301 Moved Permanently
301 Moved Permanently
openresty
 |
DIF
Balance Sheet -
Third Quarter 2013
| Fund Financial Results |
($
in millions) |
Balance
Sheet |
|
Unaudited Sep-13 |
Unaudited Jun-13 |
Quarterly
Change |
Unaudited Sep-12 |
Year-Over-Year
Change |
| Cash and cash equivalents |
$5,330 |
$531 |
$4,799 |
$1,587 |
$3,743 |
| Cash and investments - restricted - systemic risk |
- |
- |
- |
1,115 |
(1,115) |
| Investment in U.S. Treasury obligations, net |
32,729 |
33,286 |
(557) |
35,460 |
(2,731) |
| Trust preferred securities |
- |
2,240 |
(2,240) |
2,255 |
(2,255) |
| Assessments receivable, net |
2,391 |
2,594 |
(203) |
660 |
1,731 |
| Receivables and other assets - systemic risk |
- |
- |
- |
1,568 |
(1,568) |
| Interest receivable on investments and other assets, net |
409 |
533 |
(124) |
462 |
(53) |
| Receivables from resolutions, net |
16,938 |
18,442 |
(1,504) |
18,948 |
(2,010) |
| Property and equipment, net |
373 |
376 |
(3) |
379 |
(6) |
| Total Assets |
$58,170 |
$58,002 |
$168 |
$62,434 |
$(4,264) |
| Accounts payable and other liabilities |
265 |
296 |
(31) |
346 |
(81) |
| Unearned revenue - prepaid assessments |
- |
- |
- |
9,219 |
(9,219) |
| Refunds of prepaid assessments |
- |
- |
- |
- |
- |
| Liabilities due to resolutions |
15,754 |
17,179 |
(1,425) |
21,215 |
(5,461) |
| Deferred revenue - systemic risk |
- |
- |
- |
2,682 |
(2,682) |
| Postretirement benefit liability |
224 |
224 |
- |
188 |
36 |
| Contingent liability for anticipated failures |
1,164 |
2,426 |
(1,262) |
3,556 |
(2,392) |
| Contingent liability for litigation losses |
5 |
6 |
(1) |
4 |
1 |
| Total Liabilities |
$17,412 |
$20,131 |
$(2,719) |
$37,210 |
$(19,798) |
| FYI: Unrealized gain (loss) on U.S. Treasury investments, net |
39 |
(8) |
47 |
65 |
(26) |
| FYI: Unrealized gain (loss) on trust preferred securities |
- |
278 |
(278) |
293 |
(293) |
| FYI: Unrealized postretirement benefit (loss) gain |
(61) |
(61) |
- |
(34) |
(27) |
| Fund Balance |
$40,758 |
$37,871 |
$2,887 |
$25,224 |
$15,534 |
|
|
|
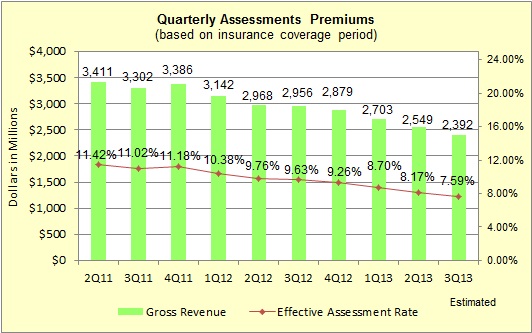
| Quarterly Assessments Premiums (based on insurance coverage period) |
| $ in Millions |
Gross Revenue |
Effective Assessment Rate |
| 2Q11 |
3,411 |
11.42% |
| 3Q11 |
3,302 |
11.02% |
4Q11 |
3,386 |
11.18% |
1Q12 |
3,142 |
10.38% |
| 2Q12 |
2,968 |
9.76% |
| 3Q12 |
2,956 |
9.63% |
| 4Q12 |
2,879 |
9.26% |
| 1Q13 |
2,703 |
8.70% |
| 2Q13 |
2,549 |
8.17% |
| 3Q13 |
2,392 |
7.59% |
|
The decline in both the gross revenue and the effective assessment rate was primarily attributed to the overall improving health of the banking industry.
|


