
Chief Financial Officer's (CFO) Report to the Board
Selected Financial Data - Third Quarter 2017
| Fund Financial Results | ($ in millions) |
| FSLIC Resolution Fund | |||||
Sep-17 |
Jun -17 |
Quarterly Change |
Sep -16 |
Year-Over-Year Change |
Cash and cash equivalents | $883 | $881 | $2 | $873 | $10 |
| Accumulated deficit | (124,606) | (124,607) | 1 | (124,616) | 10 |
| Total resolution equity | 884 | 882 | 2 | 873 | 11 |
| Total revenue | 5 | 3 | 2 | 4 | 1 |
| Operating expenses | 0 | 0 | 0 | 3 | (3) |
| Losses related to thrift resolutions | 0 | 0 | 0 | 0 | 0 |
| Net Income (Loss) | $5 | $3 | 2 | 2 | $3 |
| Receivership Selected Statistics June 2017 vs. June 2016 |
| $ in millions | DIF |
FRF |
ALL FUNDS |
||||||
| Sep-17 | Sep-16 | Change | Sep-17 | Sep-16 | Change | Sep-17 | Sep-16 | Change | Total Receiverships | 367 | 404 | (37) | - | - | - | 367 | 404 | (37) |
| Assets in Liquidation | $4,971 | $3,756 | $1,215 | $2 | $2 | - | $4,973 | $3,758 | $1,215 |
| YTD Collections | $1,260 | $1,289 | ($29) | $1 | $2 | ($1) | $1,261 | $1,291 | ($30) |
| YTD Dividend/ Other Pymts - Cash | $1,448 | $3,296 | ($1,848) | - | - | - | $1,448 | $3,296 | ($1,848) |
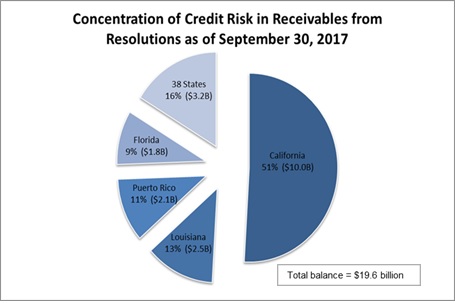
Concentration of Credit Risk in Receivables from Resolutions as of September 30, 2017 ($ in billions) |
||
| Dollars | Percentage | |
| California | $10.08 | 51 |
| 38 States | $3.28 | 16 |
| Florida | $1.88 | 9 |
| Puerto Rico | $2.18 | 11 |
| Louisiana | $2.58 | 13 |
The repayment of the receivables from resolutions is primarily influenced by recoveries on assets held by DIF receiverships and receivership payments on the covered assets under shared-loss agreements. The majority of the remaining assets in liquidation ($5.0 billion) and current shared-loss covered assets ($14.6 billion), which together total $19.6 billion, are concentrated in failed institutions located in California, Louisiana, Puerto Rico, and Florida.
Of the $19.6 billion total balance, $16.4 billion (84%) is concentrated in California, Louisiana, Puerto Rico, and Florida.