Skip Header
U.S. flag

An official website of the United States government

Chief Financial Officer's (CFO) Report to the Board

DIF Balance Sheet - First Quarter 2018
Fund Financial Results ($ in millions)
Balance Sheet
 

Mar-18

Dec-
17
Quarterly
Change

Mar-17
Year-Over-Year
Change
Cash and cash equivalents $3,119 $1,829 $1,290 $3,374 ($255)
Investment in U.S. Treasury securities 84,831 83,303 1,528 75,076 9,755
Assessments receivable, net 2,783 2,634 149 2,709 74
Interest receivable on investments and other assets, net 581 506 75 458 123
Receivables from resolutions, net 5,194 5,973 (779) 6,760 (1,566)
Property and equipment, net 325 334 (9) 340 (15)
Total Assets $96,833 $94,579 $2,254 $88,717 $8,116
Accounts payable and other liabilities 200 237 (37) 208 (8)
Liabilities due to resolutions 1,154 1,203 (49) 2,011 (857)
Postretirement benefit liability 259 259 - 232 27
Contingent liability for anticipated failures 113 98 15 1,335 (1,222)
Contingent liability for litigation losses and other 35 35 0 3 32
Total Liabilities $1,761 $1,832 $(71) $3,789 $(2,028)
FYI: Unrealized gain (loss) on U.S. Treasury securities, net (975) (479) (496) 28 (1,003)
FYI: Unrealized postretirement benefit (loss) gain (46) (46) - (26) (20)
Fund Balance $95,072 $92,747 $2,325 $84,928 $10,144
  Unrealized Gain (Loss) on U.S. Treasury Securities (per the Balance Sheet) (dollars in thousand)
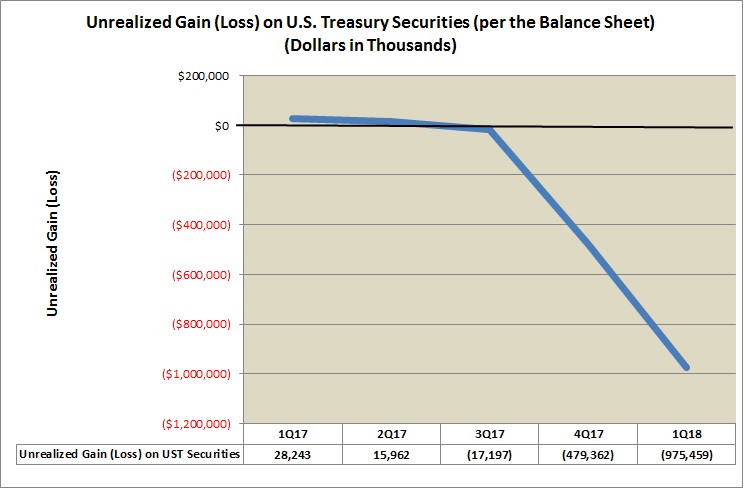
Highlights of Unrealized Gain (Loss) on U.S. Treasury Securities (per the Balance Sheet) (dollars in thousands)
Year Unrealized Gains (Loss)
1Q17 28,243
2Q17 15,962
3Q17 (17,197)
4Q17 (479,362)
1Q18 (975,459)

The larger unrealized losses on the DIF portfolio's U.S. Treasury securities lately has been the result of yields continuing to rise dramatically across all maturity sectors of the Treasury yield curve, resulting in further declines in the securities' market values relative to their book values.