
Chief Financial Officer's (CFO) Report to the Board
Selected Financial Data - First Quarter 2017
| Fund Financial Results | ($ in millions) |
| FSLIC Resolution Fund | |||||
Mar-17 |
Dec -16 |
Quarterly Change |
Mar -16 |
Year-Over-Year Change |
Cash and cash equivalents | $879 | $874 | $5 | $872 | $7 |
| Accumulated deficit | (124,609) | (124,611) | 2 | (124,617) | 8 |
| Total resolution equity | 880 | 878 | 2 | 872 | 8 |
| Total revenue | 1 | 5 | 1 | 0 | |
| Operating expenses | 0 | 3 | 1 | (1) | |
| Losses related to thrift resolutions | 0 | (1) | (1) | 1 | |
| Net Income (Loss) | $1 | $7 | $1 | $0 |
| Receivership Selected Statistics March 2017 vs. March 2016 |
| $ in millions | DIF |
FRF |
ALL FUNDS |
||||||
| Mar-17 | Mar-16 | Change | Mar-17 | Mar-16 | Change | Mar-17 | Mar-16 | Change | Total Receiverships | 375 | 439 | (64) | - | - | - | 375 | 439 | (64) |
| Assets in Liquidation | $3,006 | $4,433 | ($1,427) | $2 | $2 | - | $3,008 | $4,435 | ($1,427) |
| YTD Collections | $379 | $372 | $7 | - | $1 | ($1) | $379 | $373 | $6 |
| YTD Dividend/ Other Pymts - Cash | $1,203 | $1,789 | ($586) | - | - | - | $1,203 | $1,789 | ($586) |
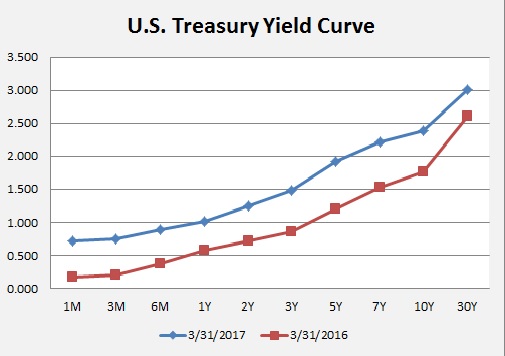
U.S. Treasury Yield Curve |
||
| Years | 03/31/2017 | 03/31/2016 |
| 1 month | 0.725 | 0.168 |
| 3 months | 0.752 | 0.198 |
| 6 months | 0.896 | 0.376 |
| 1 year | 1.016 | 0.58 |
| 2 years | 1.254 | 0.721 |
| 3 year | 1.489 | 0.852 |
| 5 years | 1.921 | 1.205 |
| 7 years | 2.21 | 1.533 |
| 10 years | 2.387 | 1.769 |
| 30 years | 3.009 | 2.612 |
Short-maturity yields have risen reflecting the Federal Reserve's December 2016 and March 2017 hike in the federal funds target rate, while longer-maturity sector securities have risen due to the expectation of higher inflation.