

Table of Contents
FDIC Contracting: Inclusion of Minority- and Women-Owned Businesses (MWOBs)
Employment at the FDIC: Increasing Representation of Minorities and Women
Introduction
Under the provisions of the Dodd-Frank Wall Street Reform and Consumer Protection Act (DFA) section 342, the Federal Deposit Insurance Corporation (FDIC) Office of Minority and Women Inclusion (OMWI) is required to submit to Congress an annual report regarding the actions taken by the agency toward hiring qualified minority and women employees and contracting with qualified minority- and women-owned businesses.
The FDIC is pleased to submit this 2016 Report to Congress. The report describes the FDIC’s activities relating to the inclusion of minorities and women in contracting and hiring for the year, as well as other relevant information, including the agency’s activities supporting financial access, economic inclusion, and financial literacy. Consistent with the provisions of section 342 of the DFA, the FDIC continues to enhance its long-standing commitment to promote diversity and inclusion in employment opportunities and all business areas of the FDIC. This report outlines both successes and challenges in contracting and hiring as the agency works to ensure that these efforts are reflected in its operations.
Commitment to Diversity and Inclusion
The mission of the FDIC is to preserve and promote public confidence in the U.S. financial system by insuring deposits, examining and supervising financial institutions for safety and soundness and consumer protection, making large and complex financial institutions resolvable, and managing receiverships. In 1999, the FDIC published its first Diversity Strategic Plan, which outlined its commitment to recruiting and retaining the most qualified, talented, and motivated employees in the labor market. OMWI is an important component in these efforts and supports the FDIC’s mission through the pursuit of equal employment opportunity, affirmative employment initiatives, diversity and inclusion, and outreach efforts to ensure the fair inclusion and utilization of minority- and women-owned businesses, law firms, and investors in contracting and investment opportunities.
In 2012, the FDIC Chairman established performance goals to update the Diversity Strategic Plan and asked each division and major office to develop strategic plans that identify steps to promote increased diversity through the FDIC's recruiting and hiring processes. Since 2013, the FDIC has annually updated the Diversity and Inclusion Strategic Plan to ensure the plan remains current and relevant. The Diversity and Inclusion Strategic Plan was updated in 2016 to continue the FDIC’s efforts in this important area and to address the FDIC’s goals to develop and implement a more comprehensive, integrated, and strategic focus on diversity and inclusion. The 2016 Diversity and Inclusion Strategic Plan was disseminated to the FDIC workforce and posted externally to the public on www.fdic.gov.
The Diversity and Inclusion Strategic Plan continues to outline a course for promoting workforce diversity by recruiting from a diverse, qualified group of potential applicants, and cultivating workplace inclusion through collaboration, flexibility, and fairness. The plan also ensures the sustainability of the FDIC’s diversity and inclusion efforts by equipping leaders with the ability to manage diversity, monitor results, and refine approaches on the basis of actionable data. There are specific steps outlined in the plan that continue to enhance diversity and inclusion at the FDIC in the areas of leadership engagement, analytics and reporting, training, communications, strategic planning, and program enhancement.
When the FDIC Board of Directors created OMWI in 2011, the Board also established an OMWI Steering Committee to ensure and promote coordination of OMWI programs. In 2013, the OMWI Steering Committee was renamed the FDIC Diversity and Inclusion Executive Advisory Council (EAC). The EAC is chaired by the FDIC Deputy to the Chairman and Chief Operating Officer/Chief of Staff and includes the OMWI Director, the OMWI Senior Deputy Director, FDIC division and office directors, and other key FDIC senior staff. The EAC provides leadership on diversity and inclusion initiatives throughout the FDIC. The EAC also reviews the Diversity and Inclusion Strategic Plan annually, and updates it as needed to refine the agency’s efforts in promoting diversity and inclusion on an ongoing basis.
2016 Diversity and Inclusion Initiatives
Annually, the FDIC Chairman issues a number of performance goals designed to further promote diversity, inclusion, and equal employment opportunity at the agency. One of these goals required the agency’s division and major office directors to develop customized strategic plans for their organizations to identify steps to promote increased diversity throughout the FDIC. Again in 2016, each division and major office assessed available workforce data and produced plans with strategies to further their diversity progress and address noted issues. The division and office level plans were consolidated into an FDIC Plan to Promote Increased Diversity through Division/Office Engagement and have been integrated into the agency’s annual strategic planning efforts. In July 2016, the progress made by divisions and major offices was reported and discussed at the monthly EAC meeting. This process keeps the division and major offices engaged in the FDIC’s diversity and inclusion efforts and will continue in 2017.
The FDIC is committed to continually providing all employees with a work environment that promotes excellence and acknowledges and honors the diversity of its employees. The Diversity and Inclusion Strategic Plan was revised in late 2016 and was disseminated to the FDIC workforce and posted on the FDIC website in early 2017. The 2017 Diversity and Inclusion Strategic Plan includes updated strategies to continue the FDIC’s success in ensuring that all employees are valued members of the workplace and active participants in carrying out the FDIC’s mission.
In recognition of the FDIC’s 2016 diversity and inclusion progress, the following initiatives are highlighted:
The FDIC supported the establishment of an additional Employee Resource Group, the Veterans Employee Resource Group (VERG), and continued to support, and encouraged collaboration with the four existing ERGs: Emerging Leaders; Hispanic Organization for Leadership and Advancement; PRIDE; and Partnership of Women in the Workplace.
OMWI and the FDIC’s Corporate University explored opportunities to provide diversity and inclusion training for employees in an online environment. OMWI continued administering manager and supervisor training on equal employment opportunity and diversity and inclusion, No FEAR Act training, and webinars on anti-harassment and non-discrimination in employment policies and procedures.
- The FDIC completed the implementation of the recommendations from the Office of Inspector General’s Review of the FDIC’s Efforts to Promote Equal Opportunity and Achieve Senior Management Diversity. The following improvements were implemented:
Formalized recruitment strategy;
Developed metrics to measure recruitment success;
Developed process to track and report on leadership training programs participation by race, gender and national origin;
Developed a policy and procedures for “Expressions of Interest (EOI)” programs; and,
Developed a process to track EOI participation by race, gender, and national origin.
-
The FDIC implemented innovative procurement strategies on several contracts to foster increased minority- and women- owned business participation in contracting opportunities.
Through focused outreach, internal and external training, and related initiatives, the FDIC Legal Division increased the percentage of minority- and women-owned law firm referrals and payments for agency legal matters.
- The FDIC’s Workplace Excellence (WE) program, composed of a national WE Steering Committee and division/office WE Councils, continued the focus on maintaining, enhancing and institutionalizing a positive workplace environment throughout the agency. OMWI worked closely with WE to develop and provide recommendations related to fairness, diversity and inclusion, to include:
Conducting and presenting a preliminary analysis of Federal Employee Viewpoint Survey results and trends delineated by FDIC dimension and minority, gender, ethnicity, and disability status; and,
Forming a joint Fairness, Diversity and Inclusion Working Group composed of WE Steering Committee, Council, and Chairman’s Diversity Advisory Council members to further evaluate available information in an effort to better understand how employees in different demographic groups view the FDIC workplace.
- The FDIC continued to develop and implement the Workforce Development Initiative (WDI) designed to address comprehensive succession planning needs and workforce development challenges and opportunities, and to develop future FDIC leaders. As a part of the initiative, OMWI:
Continued to track succession planning review results by race, ethnicity, and gender and provide the results to WDI program management;
Provided guidance as needed about potential diversity and inclusion issues in other WDI programs e.g., career paths, external details, learning, development and training, leadership mentoring, administrative career paths; manager rotations, and onboarding; and,
Participated in efforts to research opportunities to make better use of social media resources, particularly LinkedIn, in corporate recruiting outreach efforts to attract applicants from diverse backgrounds.
FDIC Contracting: Inclusion of Minority- and Women-Owned Businesses (MWOBs)
The FDIC places a high priority on achieving diversity in contracting and asset sales, and OMWI is an integral part of the contractor solicitation, education, and evaluation process. During 2016, the FDIC implemented new contracting initiatives and conducted focused outreach which improved MWOB participation in its contracting activities. However, the FDIC continued to face challenges in increasing the utilization and growth rates for MWOB contractors because new contract awards by the FDIC have been declining since the height of the financial crisis and non-financial goods and services contracts for recurring needs represent a larger percentage of FDIC contracts. The FDIC will analyze future contracting needs to determine where MWOB opportunities may exist and if new procurement strategies can be used to maximize MWOB participation. The following sections provide detailed information on the agency’s 2016 contracting activities and successes; contracting initiatives, programs, and outreach; and challenges the FDIC faces in increasing MWOB participation in its contracting activities.
Contracting Activities and Successes
FDIC Procurement Policies
The FDIC’s contracts are typically awarded through a competitive, best-value solicitation process that involves consideration of both the offeror’s technical and price proposals. The solicitations describe what offerors must include in their proposals and the proposal evaluation criteria specific to the good or service being procured. Proposals are evaluated and rated by a panel of FDIC subject matter experts and include an OMWI representative. Awards are made to the offeror that provides the best value to the FDIC.
For any contract over $100,000, OMWI review is required to identify competitive minority- and women-owned businesses to include in contract solicitations. As part of this process, OMWI uses the FDIC’s Contractor Resource List that includes registered MWOBs. OMWI also identifies qualified MWOBs through the System for Award Management and the Minority Business Development Agency. This process helps ensure a diverse pool of contractors is solicited and considered for each major contract.
The FDIC’s website1 provides information, announcements, and technical assistance for minority- and women-owned businesses, law firms, and investors seeking to do business with the FDIC. The FDIC also has a small business resource page that contains more than 40 learning modules2 and is a technical assistance aid and self-assessment for businesses interested in competing for contract opportunities.
1. See www.fdic.gov/mwop.
2. See www.fdic.gov/about/diversity/sbrp/index.html.
Contract Payments with MWOBs
The FDIC paid $415.2 million to contractors in 2016 under 1,786 contracts, of which $111.5 million (26.8 percent) was paid to MWOBs under 461 contracts. [See Figure 1.] By comparison, the FDIC paid $507.2 million to contractors under 2,029 contracts in 2015; $491.6 million to contractors under 1,962 contracts in 2014; $553.7 million to contractors under 1,982 contracts in 2013; and $660.0 million to contractors under 577 contracts in 2012. The 2016 total payments (i.e., spend) to contractors included payments for contracts awarded in 2016 and payments for active contracts awarded prior to 2016.
| Figure 1 Contracting Payments (in millions) | |||||
|---|---|---|---|---|---|
| 2012 | 2013 | 2014 | 2015 | 2016 | |
| Total | $660.0 | $553.7 | $491.6 | $507.2 | $415.2 |
| 100.0% | 100.0% | 100.0% | 100.0% | 100.0% | |
| MWOB | $161.4 | $140.6 | $128.2 | $142.5 | $111.5 |
| 24.5% | 25.4% | 26.1% | 28.1% | 26.8% | |
| Minority Owned (MO) | $117.7 | $102.9 | $89.3 | $89.3 | $56.0 |
| 17.8% | 18.6% | 18.2% | 17.6% | 13.5% | |
| Women Owned (WO) | $70.1 | $63.7 | $63.6 | $83.2 | $66.8 |
| 10.6% | 11.5% | 12.9% | 16.4% | 16.1% | |
| Overlap (Both MO & WO) | $26.4 | $26.0 | $24.7 | $30.0 | $11.3 |
| 4.0% | 4.7% | 5.0% | 5.9% | 2.8% | |
| Asian American | $51.3 | $50.3 | $38.5 | $39.9 | $33.5 |
| 7.8% | 9.1% | 7.9% | 7.9% | 8.1% | |
| Black American | $35.7 | $19.8 | $15.9 | $13.3 | $11.5 |
| 5.4% | 3.6% | 3.2% | 2.6% | 2.8% | |
| Hispanic American | $28.7 | $26.0 | $26.7 | $25.1 | $10.3 |
| 4.3% | 4.7% | 5.4% | 5.0% | 2.5% | |
| Native American | $2.0 | $1.2 | $0.3 | $0.1 | $0.1 |
| 0.3% | 0.2% | 0.1% | 0.0% | 0.0% | |
For purposes of contract payment information, the FDIC considers an active contract one in which payments were made or credits applied in 2016. In 2016, minority-owned firms were paid $56 million of the total dollars paid to contractors (13.5 percent). Women-owned firms were paid $66.8 million of the total dollars paid to contractors (16.1 percent). These two categories – minorities and women – are not mutually exclusive since $11.3 million (2.8 percent) was paid in 2016 to businesses classified as both minority-owned and women-owned. By contrast, the FDIC paid MWOBs $142.5 million (28.1 percent) of the total paid to all contractors in 2015 under 591 contracts; $128.2 million (26.1 percent) to MWOBs in 2014 under 533 contracts; $140.6 million (25.4 percent) to MWOBs in 2013 under 608 contracts; and $161.4 million (24.5 percent) to MWOBs in 2012 under 754 contracts.
In 2016, the FDIC awarded 287 contracts to MWOBs out of a total of 1,181 issued (24.3 percent). [See Figure 2.] By comparison, the FDIC awarded 346 contracts (29.9 percent) to MWOBs out of a total of 1,159 issued in 2015; 288 contracts (26.9 percent) to MWOBs out of a total of 1,072 issued in 2014; 282 contracts (28.3 percent) to MWOBs out of a total of 995 issued in 2013; and 388 contracts (29.3 percent) out of a total of 1,326 issued in 2012.
| Figure 2 Contracting Actions | |||||
|---|---|---|---|---|---|
| 2012 | 2013 | 2014 | 2015 | 2016 | |
| Total | 1326 | 995 | 1072 | 1159 | 1181 |
| 100.0% | 100.0% | 100.0% | 100.0% | 100.0% | |
| MWOB | 388 | 282 | 288 | 346 | 287 |
| 29.3% | 28.3% | 26.9% | 29.9% | 24.3% | |
| Minority Owned (MO) | 262 | 161 | 170 | 148 | 142 |
| 19.8% | 16.2% | 15.9% | 12.8% | 12.0% | |
| Women Owned (WO) | 192 | 162 | 167 | 243 | 187 |
| 14.5% | 16.3% | 15.6% | 21.0% | 15.8% | |
| Overlap (Both MO & WO) | 66 | 41 | 49 | 45 | 42 |
| 5.0% | 4.1% | 4.6% | 3.9% | 3.5% | |
| Asian American | 50 | 39 | 54 | 56 | 62 |
| 3.8% | 3.9% | 5.1% | 4.8% | 5.2% | |
| Black American | 104 | 50 | 45 | 35 | 24 |
| 7.8% | 5.0% | 4.2% | 3.0% | 2.0% | |
| Hispanic American | 87 | 61 | 59 | 39 | 48 |
| 6.6% | 6.2% | 5.5% | 3.4% | 4.1% | |
| Native American | 18 | 0 | 2 | 1 | 2 |
| 1.4% | 0.0% | 0.2% | 0.1% | 0.2% | |
| Other | 3 | 11 | 10 | 17 | 6 |
| 0.2% | 1.1% | 0.9% | 1.5% | 0.5% | |
As of December 31, 2016, the FDIC had 302 (17.3 percent) active contracts with MWOBs out of a total of 1,745 active contracts. The active contracts to MWOB firms by category were as follows: Asian American (92), Black American (51), Hispanic American (28), Native American (2), and Women (169). These include contracts awarded to firms that were both minority-owned and women-owned.
Contract Awards with MWOBs
The FDIC awarded contracts with a combined value of $508.8 million in 2016, of which $93.9 million (18.5 percent) were awarded to MWOBs. By comparison, the FDIC awarded contracts with a combined value of $858.4 million in 2016, with $211.6 million (24.7 percent) awarded to MWOBs; awarded contracts with a combined value of $686.8 million in 2014, with $239.9 million (34.9 percent) awarded to MWOBs; awarded contracts with a combined value of $572.8 million in 2013, with $198.7 million (34.7 percent) awarded to MWOBs; and awarded contracts with a combined value of $1,041.7 billion in 2012, with $308.0 million (29.6 percent) awarded to MWOBs. [See Figure 3.]
| Figure 3 Total Contract Dollar Awards | |||||
|---|---|---|---|---|---|
| 2012 | 2013 | 2014 | 2015 | 2016 | |
| Total | $1,041.7 | $572.8 | $686.8 | $858.4 | $508.8 |
| 100.0% | 100.0% | 100.0% | 100.0% | 100.0% | |
| MWOB | $308.0 | $198.7 | $239.9 | $211.6 | $93.9 |
| 29.6% | 34.7% | 34.9% | 24.7% | 18.5% | |
| Minority Owned (MO) | $261.1 | $158.5 | $143.7 | $145.2 | $56.5 |
| 25.1% | 27.7% | 20.9% | 16.9% | 11.1% | |
| Women Owned (WO) | $90.7 | $66.1 | $132.6 | $104.2 | $47.4 |
| 8.7% | 11.5% | 19.3% | 12.1% | 9.3% | |
| Overlap (Both MO & WO) | $43.8 | $25.9 | $36.4 | $37.8 | $10.0 |
| 4.2% | 4.5% | 5.3% | 4.3% | 1.9% | |
| Asian American | $92.6 | $38.0 | $27.1 | $51.8 | $25.0 |
| 8.9% | 6.7% | 4.0% | 6.0% | 4.9% | |
| Black American | $105.6 | $32.2 | $21.3 | $30.7 | $9.4 |
| 10.1% | 5.6% | 3.1% | 3.6% | 1.9% | |
| Hispanic American | $50.0 | $85.3 | $66.1 | $43.2 | $20.6 |
| 4.8% | 14.9% | 9.6% | 5.0% | 4.0% | |
| Native American | $9.3 | $- | $0.8 | $- | $0.1 |
| 0.9% | 0.0% | 0.1% | 0.0% | 0.0% | |
| Other | $3.6 | $3.0 | $28.4 | $19.5 | $1.4 |
| 0.4% | 0.5% | 4.1% | 2.3% | 0.3% | |
The FDIC’s five-year trend from 2012-2016 of contract awards and payments can be found at Appendix A.
Contract Awards by North American Industry Classification System
The North American Industry Classification System (NAICS) was developed by the Office of Management and Budget (OMB) and is the standard used by federal statistical agencies in classifying business establishments for the purpose of collecting, analyzing, and publishing statistical data related to the U.S. business economy. The FDIC awarded contracts in 2016 under 85 different NAICS codes. Figure 4 depicts the distribution of the FDIC’s 2016 contracts categorized for the top ten NAICS codes.
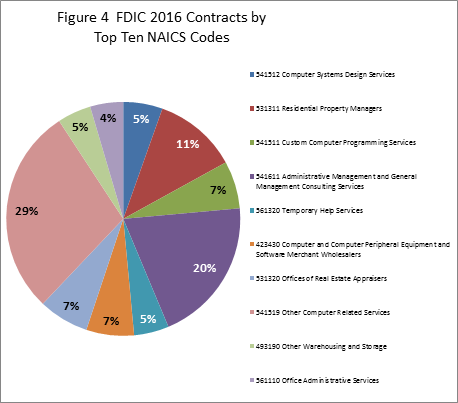
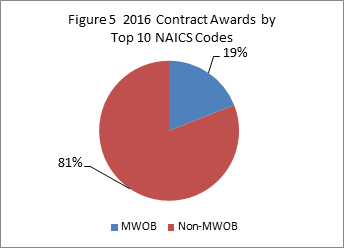
In 2016, these awards consisted of the following: 29 percent for other computer-related services; 20 percent for administrative management and general management consulting services; and 11 percent for residential property managers. The remaining 40 percent – each seven percent or under – were awarded in the areas of real estate appraisers (seven percent); computer and computer peripheral equipment and software merchant wholesalers (seven percent); custom computer programming services (seven percent); computer systems design services (five percent); temporary help services (five percent); other warehousing and storage (five percent); and office administrative services (four percent). Collectively, 19 percent of the top ten NAICS code contracts were awarded to MWOBs. [See Figure 5.]
The 2016 FDIC contract awards associated with the top ten NAICS codes can be found in Appendix B.
Referrals to Law Firms
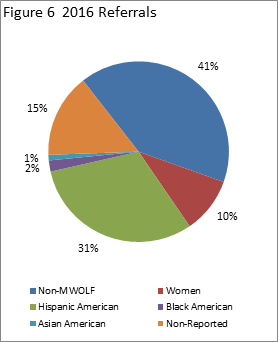
Referrals to law firms are typically made on a competitive basis. Price, expertise, capacity, and status are among the criteria considered in making the selections. The FDIC made 342 referrals to outside counsel in 2016, of which 151 (44.2 percent) were minority- and women-owned law firms (MWOLFs), compared to a total of 600 referrals, of which 244 (40.7 percent) were to MWOLFs in 2015. Referrals to MWOLFs in 2016, by category, were as follows: Black American – 6 (2.0 percent), Hispanic American – 107 (31 percent), Native American – 1 (<1 percent), Asian American – 2 (1 percent), and Women – 35 (10 percent). [See Figure 6.]
The FDIC paid $76.8 million to outside counsel in 2016, as compared to $98.4 million in 2015. [See Figure 7.] The FDIC paid $11.1 million to MWOLFs in 2016, which represents 14.5 percent of the total paid to all law firms. This percentage exceeds 2015, during which the FDIC paid a total of $11.7 million to MWOLFs, which was 11.9 percent of the total paid to all law firms that year.
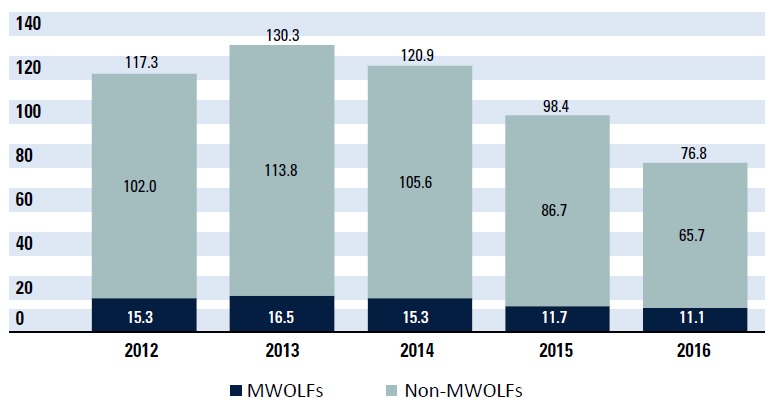
As noted above, there has been a decline in referrals to outside counsel in 2016. Bank resolution activities, which are a major source of outside counsel work, decreased from 2015 to 2016. Furthermore, as shown in Figure 7, payments to MWOLFs decreased from $11.7 million in 2015 to $11.1 million in 2016. This decrease is consistent with the overall decline in FDIC fees spent on outside counsel since the peak levels in 2013.
The FDIC remains committed to seeking ways to increase the level of referrals to MWOLFs in 2017.
Outreach to MWOLFs
Anticipating a decline in legal referrals in 2016, the Legal Division tailored its outreach strategy to focus on the substantive areas of the FDIC’s legal work that posed the greatest opportunities for MWOLF participation. The Legal Division continued to work closely with in-house attorneys in areas that account for a substantial dollar amount of legal referrals (e.g., professional liability and financial crimes). The Legal Division continued to emphasize the importance of diverse staffing. For example, in response to the needs of the Legal Division’s Professional Liability and Financial Crimes Section, the Legal Division is developing a user-friendly searchable database highlighting available minority- and women-owned legal support firms such as expert witnesses and court reporters. Given the decline in bank failures, the Legal Division anticipates performing more work in-house, which will require legal support. To assist in that effort, the Legal Division anticipates awarding litigation support contracts to minority- and women-owned legal support firms. The Legal Division worked on a new program to enhance the MWOLF program spend figures by capturing the fees paid by larger firms and FDIC loan servicers that use MWOLFs as subcontractors.
In addition to attending five bar association conferences during 2016, Legal Division staff attended three stakeholder events sponsored by the National Association of Minority and Women Owned Law Firms (NAMWOLF). During these networking events, the Legal Division counseled MWOLFs on how those firms can make strategic decisions in their pursuit of FDIC legal work, as well as work with other large corporate clients. It is also noteworthy that the FDIC redesigned and increased its advertising space in the organization’s annual diversity and inclusion magazine.
The Legal Division evaluated and approved 12 new MWOLF applications in 2016. Firms from various geographic areas were added to the FDIC List of Counsel Available in order to be eligible to receive legal contracting work. In addition, the Legal Division continued a compliance review program developed in 2012 to assess internal diversity of majority law firms and MWOLFs comprising the FDIC’s “top ten” annual spending firms. This program provides the Legal Division another means to address diversity and inclusion and provides opportunities for women and minority attorneys seeking to provide services. These on-site visits are designed to engage firms in discussions about best practices, diversity staffing concepts, metrics and the FDIC’s MWOLF program. The results continue to be positive. The FDIC collected baseline diversity metrics, reviewed best practices on staffing of client matters, and reached a commitment with various firms to increase diversity concerning FDIC activities.
Contracting Initiatives, Programs and Outreach
During the financial crisis, contracts related to services required to resolve failed financial institutions represented up to 85 percent of all FDIC contract dollars awarded in a given year. Due to the continued decline in the number of failed financial institutions, only 44 percent of FDIC total contract dollars awarded in 2016 supported the FDIC’s Division of Resolutions and Receiverships (DRR) whose primary mission is to resolve failed financial institutions. As a result, the FDIC continued to focus efforts in 2016 on identifying opportunities for MWOBs in non-financial recurring services. For example, contracts were awarded to MWOBs in the following areas: IT software development, maintenance and shared services; IT hardware and software licenses; IT security; IT consulting services; printing services; receptionist services; human resources program services; risk-modeling services; interpreting services; facilities management services; and training.
In addition, several of the contracts used to perform failed bank resolution services during the financial crisis expired in 2016. Although the number of bank failures has declined significantly, the FDIC re-bid these expiring contracts to ensure contractor resources are in place to provide assistance for future bank failures. MWOB contractors were instrumental to the FDIC’s success during the financial crisis. As a result, the FDIC focused on ensuring continued MWOB participation in the rebidding of expiring contracts. MWOB firms were awarded new contracts in 2016 for receivership management support services, information security support services, business improvement support services, and pre-closing and post-closing resolution support services. Additional existing failed bank resolution contracts will expire in 2017 and beyond. The FDIC will continue to look for opportunities to include MWOBs in the re-competition of these mission critical services.
The FDIC continued to develop procurement strategies for major solicitations at monthly EAC meetings attended by senior managers from FDIC divisions and offices, and at the FDIC’s Executive Management Committee meetings. Lastly, the FDIC continued to implement the recommendation to hold pre-proposal conferences to ensure businesses understand the FDIC’s requirements before a solicitation is issued and to give smaller businesses opportunities to find partners and develop teams before submitting bids.
The FDIC continued its voluntary usage of the Small Business Administration’s 8(a) program which is designed to help small and disadvantaged businesses compete in the marketplace and gain access to federal and private procurement markets. In 2016, the FDIC awarded two contracts to MWOBs with a combined value of $1,345,200 under the 8(a) program. One will assist the FDIC in developing a new IT continuity of operations strategy. The other is for the installation of two distribution units at the FDIC’s Data Center.
Information Technology Contracting
The FDIC recognized in 2012 that the declining number of bank failures would result in a significant shift in new contract award opportunities from bank resolution contracts to contracts for daily operations (e.g., IT software development and maintenance, facilities management, etc.). The FDIC conducted focused market research in 2012 to ensure significant MWOB participation in the then upcoming $546.8 million competitive Basic Ordering Agreement (BOA) for the second generation Information Technology Application Services (ITAS II) contract. This focused market research led to six MWOB firms being awarded an ITAS II BOA out of 11 total firms awarded the BOA (55 percent). The six BOA awards to MWOBs represented a significant increase in MWOB awards from the ITAS I BOA where only one MWOB firm was awarded the BOA out of four total firms (25 percent). In 2016, the FDIC conducted a competition to add additional firms to the ITAS II BOA to increase the number of vendors under the contract. Once again, significant market research was conducted to ensure MWOB participation in the competitive process. The end result was three additional firms were added to the ITAS II BOA with two of the firms being MWOB firms. This increased the total number of firms under the ITAS II BOA from 11 to 14 and the total number of MWOB firms under the ITAS II BOA from six to eight. As a result, the percentage of MWOB firms under the BOA increased from 55 to 57 percent.
The assignment of work to contractors under the ITAS II BOA is accomplished through the award of task orders that are competed among the contractors awarded the BOA. A significant number of multi-year task order awards were made under ITAS II between 2013 and 2015 resulting in fewer requirements for new task orders in 2016. However, 12 of the 17 task orders in 2016 under the ITAS II BOA were awarded to MWOB firms with a combined value of $11.2 million. This represented 71 percent of the total task orders awarded and 77 percent of the total dollars awarded under ITAS II during 2016.
ITAS II is not the only contract that supports the FDIC’s Information Technology program. The FDIC awarded in 2016, four new contracts with a combined value of $1.2 million to MWOBs to provide: (1) secure web authentication services; (2) open FISMA operations and support services; (3) automated loan examination tool services; and (4) strategic communications support.
The FDIC is also in the process of evaluating the move of some IT services to cloud technology services. A contract valued at $443,999 was awarded to an MWOB to provide support to move some FDIC IT services to cloud technology services.
Additionally, the FDIC is reassessing its current IT continuity of operations strategy. One contract with a value of $1.2 million was awarded to an MWOB firm to assist with this assessment by providing technical inventory planning and organizational change management services.
Lastly, the FDIC also recognizes that IT hardware and software can often be provided by resellers certified by the manufacturer or by MWOB manufacturers. As a result, the FDIC continued with the strategic decision to solicit MWOBs for hardware and software purchases when possible. This strategy resulted in 87 contract awards to MWOBs with a combined value of $14.1 million.
Facilities Management
Significant awards to MWOBs in facilities management included contracts valued at $145,200 for power distribution for the FDIC Data Center; $61,519 for lighting design at the FDIC’s San Francisco Regional Office location; and $3.4 million for commercial printing services.
In addition, the FDIC continued to provide opportunities to MWOBs for replacement furniture. In total, seven contracts with a combined value of $649,577 were awarded to MWOBs to provide furniture for multiple FDIC locations nationwide.
Human Resources Management
Three contracts were awarded to MWOBs in 2016 in the human resources management area. The FDIC strategically removed receptionist services from the existing administrative support services contract after determining these services represented more than 10 percent of the value of the contract and could be provided by MWOB firms. This strategy change resulted in a new competitive contract for receptionist services that was awarded to an MWOB with a value of $1.8 million. Also a contract valued at $900,000 was awarded to an MWOB to support the evaluation of an FDIC human resources program. Lastly, a contract valued at $80,984 was awarded to an MWOB firm to provide employee mentoring support services.
Bank Resolution Contracts
There were only five financial institution failures in 2016, continuing the decline in annual bank failures and far below the height of the financial crisis in 2010 when there were 157 financial institution failures. However, there are still hundreds of active failed bank receiverships from prior year failures. The FDIC continued to award contracts to MWOBs to provide the required services to resolve 2016 financial institution failures and prior year financial institution failures. In 2016, 152 contracts with a combined value of $54 million were awarded to MWOBs to provide the required financial services to assist the FDIC in resolving failed financial institutions. Contracts awarded to MWOBs related to the resolution of failed financial institutions included, but were not limited to, owned real estate management and disposition services, accounting services, IT development and reporting services, information security support services, receivership assistance services, loss share agreement services, asset valuation services, appraisal management services, underwriting services, temporary staffing services, internet marketing and disposition of loan assets services, environmental support services, furniture/fixtures and equipment services, tax return preparation services, oil and gas services, and translation/transcreation/interpreter services.
Other Significant MWOB Contract Awards
Recognizing the need to expand MWOB contract awards beyond services for bank resolutions, information technology, human resources and facilities management, the FDIC looked for MWOB opportunities in other program areas. The FDIC’s Corporate University awarded eight contracts with a combined value of over $2 million to MWOB firms to provide training to FDIC employees on a variety of subjects. The FDIC’s Division of Depositor and Consumer Protection (DCP) awarded a contract with a value of $80,000 to an MWOB to provide Money Smart training services. The Office of Corporate Risk Management awarded a contract with a value of $1 million to an MWOB firm to provide risk modeling services. Lastly, OMWI awarded a contract to an MWOB with a value of $900,000 for sign language interpreter/transcribing services.
Outreach to MWOBs
In 2016, the FDIC participated in a combined total of 38 business expos, one-on-one matchmaking sessions, and panel presentations. At these events, the FDIC staff provided information and responded to inquiries regarding the FDIC’s business opportunities for minorities and women. In addition to targeting MWOBs, MWO investors, and MWOLFs, these efforts also targeted veteran-owned and small disadvantaged businesses. Vendors were also encouraged to register through the FDIC’s Contractor Resource List (the principal database for vendors interested in doing business with the FDIC).
FDIC Asset Sales
During 2016, OMWI and DRR collaborated to present three FDIC-sponsored asset purchaser workshops that were marketed extensively to minority- and women-owned investors and companies interested in learning about DRR’s sales processes. DRR speakers with strong backgrounds in their respective programs provided details on the various tools used by DRR to market assets and presented information to attendees on how to participate in the transactions and bid on assets offered for sale. Also, OMWI staff presented sessions on Doing Business with the FDIC.
Asset purchaser workshops were held in San Juan, Puerto Rico and in Memphis and Jackson, Tennessee. The events were attended by 76 prospective investors and included a special focus on owned real estate investment opportunities to support a DRR auction of real estate properties scheduled after the outreach workshop. A segment regarding contracting services was also part of the event. In addition, in May 2016, OMWI and DRR held a workshop in San Juan in support of an owned real estate auction. The workshop and subsequent auction attracted more than 160 participants and all available properties were sold in the auction.
Following the failure of a financial institution in Memphis, additional asset purchaser workshops were held in July 2016. Two sessions were held to target local purchasers in Jackson where most of the properties were located. The events focused on the owned real estate portfolio acquired in the financial institution’s resolution, which consisted primarily of affordable single family homes.
Challenges
As noted, the FDIC’s annual new contract awards have declined significantly since the height of the financial crisis due to the reduction in financial institution failures. The total value of FDIC’s 2016 contract awards of $508.8 million was significantly less than the $858.4 million contract award value for 2015. This continued the downward trend in contract award values since the height of the financial crisis when awards peaked at $2.6 billion in 2009 and 2010. Non-financial goods and services contracts for supporting daily operations are continuing to represent a larger percentage of FDIC annual contract awards. In years when there are few bank failures, these non-financial recurring goods and services will represent the majority of FDIC contract awards. Typical contract awards for non-financial goods and services (for example, dental, life, and vision insurance for employees; subscription services; office supplies; security guard services; facilities management services; and IT services) may range from $300 million to $500 million annually.
While smaller firms that are not national in scope are capable of providing some of these services, there are significant administrative advantages to having fewer contractors provide these services to ensure consistent implementation of FDIC programs nationwide. The FDIC will continue to assess and analyze future contracting needs to determine where MWOB opportunities may exist or if new methods of service delivery are feasible. As described above, a new procurement strategy was developed for receptionist services which resulted in a $1.8 million award to an MWOB firm. Also, contracts to assist in moving IT services to the cloud and to develop a new continuity of operations strategy, were awarded to MWOB IT contractors. These are examples of the types of procurement strategies the FDIC will continue to consider for future new contracts, when feasible. Despite the decline in the overall contract dollars, the FDIC through its aggressive outreach program continues to educate and equip MWOBs with the tools they need to compete for contracting opportunities. In 2016, OMWI initiated a study of MWOB participation in FDIC contracting opportunities. The results of the study will help provide information on where additional technical assistance could be provided to MWOBs to increase their ability to compete in the future.
Employment at the FDIC: Increasing Representation of Minorities and Women
The FDIC is strongly committed to diversity and inclusion at all levels of the agency’s workforce. The following sections provide information on the agency’s diversity in employment and hiring, initiatives to promote diversity in employment, and challenges the agency faces in promoting diversity in employment and hiring.
Diversity in Employment and Hiring
As of December 31, 2016, minorities accounted for 28.0 percent (1,771) of the FDIC’s total workforce (permanent and non-permanent) of 6,322 employees, and women accounted for 44.8 percent (2,831). [See Figure 8.] More specifically, the representation percentages in the total workforce for various minority groups at the end of December 2016 were as follows: 1.2 percent for people of two or more races, 0.6 percent American Indian and Alaska Native (AIAN), 5.1 percent Asian American, 17.4 percent Black American, and 3.8 percent Hispanic American.
Figure 8 Diversity in Total – (Permanent and Non-Permanent) Employment as of 12/31/2016
| Minority | Non-Minority | Total | |
|---|---|---|---|
| Number | 1771 | 4551 | 6322 |
| Percent | 28.0 | 72.0 | 100% |
| Men | Women | Total | |
|---|---|---|---|
| Number | 3491 | 2831 | 6322 |
| Percent | 55.2 | 44.8 | 100% |
| 2 or More | AIAN | Asian | Black | Hispanic | White | Total | |
|---|---|---|---|---|---|---|---|
| Number | 76 | 36 | 321 | 1099 | 239 | 4551 | 6322 |
| Percent | 1.2% | 0.6% | 5.1% | 17.4% | 3.8% | 72.0% | 100% |
The racial, ethnic, and gender diversity of the FDIC’s workforce overall has improved slightly since the passage of DFA section 342. Minorities accounted for 26.2 percent of the FDIC’s permanent workforce as of July 31, 2010, and 28.2 percent as of December 31, 2016. The percentage of women in the FDIC’s permanent workforce was 43.6 percent as of July 31, 2010, and 45.1 percent as of December 31, 2016. [See Appendix C.]
As of December 31, 2016, minorities accounted for 18.8 percent (25) of the FDIC’s total Executive Manager (EM) workforce of 133 employees, and women accounted for 36.8 percent (49). [See Figure 9.]
Figure 9 Diversity in Total (Permanent and Non-Permanent) Employment – Executive Manager Workforce as of 12/31/2016
| Minority | Non-Minority | Total | |
|---|---|---|---|
| Number | 25 | 108 | 133 |
| Percent | 18.8 | 81.2 | 100% |
| Men | Women | Total | |
|---|---|---|---|
| Number | 84 | 49 | 133 |
| Percent | 63.2 | 36.8 | 100% |
| 2 or More | AIAN | Asian | Black | Hispanic | White | Total | |
|---|---|---|---|---|---|---|---|
| Number | 0 | 1 | 2 | 18 | 4 | 108 | 133 |
| Percent | 0 | 0.8 | 1.5 | 13.5 | 3.0 | 81.2 | 100% |
Of the FDIC’s permanent EM workforce, minorities accounted for 15.4 percent as of July 31, 2010, and 18.2 percent as of December 31, 2016. The percentage of women in the FDIC’s permanent EM workforce was 25.0 percent as of July 31, 2010, and 36.4 percent as of December 31, 2016. The racial, ethnic and gender diversity of the EM workforce overall has increased since the passage of DFA section 342.
Appendix C depicts the FDIC’s five-year trends for the total, permanent, and EM workforce for 2012 through 2016.
Initiatives to Promote Diversity in Employment
The FDIC promotes its commitment to a diverse workforce through a wide variety of methods aimed at attracting, recruiting, hiring, and retaining high-performing individuals who reflect all segments of society. The recruitment of examiners, the FDIC’s largest occupational group, is conducted primarily through the FDIC’s Corporate Employee Program (CEP). The CEP recruits and trains the FDIC’s workforce of Financial Institution Specialists (FISs), beginning examiners-in-training, in many areas.
To help with recruitment throughout 2016, OMWI tracked and informed FDIC leadership about the representation and attrition rates for CEP participants based on race, ethnicity, and gender. Reports on participation rates were prepared following each incoming class of CEP hires, and each report included the total CEP participants from the inception of the program, FISs currently onboard, and voluntary and involuntary attrition information. For the years from the inception of the CEP in 2005, several racial, ethnic and gender groups, as well as employees with disabilities, had very low representation rates in the FDIC’s examiner workforce. To help address these issues, the FDIC has engaged in a proactive recruitment effort and used recruiting strategies that have been successful in addressing the initially low representation rates of many racial, ethnic, and gender groups. That progress is especially apparent with respect to the overall percentage of women in the examiner workforce, which increased from 33.5 percent as of December 31, 2004, to 38.2 percent as of December 31, 2016. In addition, the percentages of Black American men and women, Hispanic American women, Asian American men and women, American Indian and Alaska Native women, and White women in the overall examiner workforce all have increased since the beginning of the CEP. Despite the positive progress in those areas, the representation rates of Hispanic American women and Asian American men and women, and women of two or more races in the FDIC’s examiner workforce remain low.
Also, since the inception of the CEP, hiring rates have been at or above the percentages in the Civilian Labor Force (CLF) for American Indian and Alaska Native men and women, Black American men and women, and men of two or more races, but lower than the CLF for Asian American men and women, Hispanic American men and women, White women, and women of two or more races. The overall minority hiring rate since the inception of the CEP has been 27.9 percent, compared to the CLF of 27.7 percent; and the overall hiring rate for women is 38.0 percent, compared to the CLF of 45.3 percent. [See Figure 10.]
| Figure 10 CEP Hires Since Inception | |||||||||||||
|---|---|---|---|---|---|---|---|---|---|---|---|---|---|
| 2 or More | AIAN | Asian | Black | Hispanic | White | Total | |||||||
| Women | Men | Women | Men | Women | Men | Women | Men | Women | Men | Women | Men | ||
| CEP | 11 | 15 | 4 | 11 | 29 | 52 | 159 | 110 | 30 | 43 | 399 | 802 | 1665 |
| % | 0.7 | 0.9 | 0.2 | 0.7 | 1.7 | 3.1 | 9.5 | 6.6 | 1.8 | 2.6 | 24.0 | 48.2 | 100% |
| CLF | 1 | 0.6 | 0.2 | 0.1 | 3.7 | 3.5 | 8.4 | 3.4 | 3.7 | 3.1 | 28.3 | 44.1 | 100% |
During 2016, the CEP hiring rates were above the CLF percentages for American Indian and Alaska Native women, Black American men, and men and women of two or more races, and were below the CLF for Asian American men and women, Black American women, and Hispanic American men and women. The hiring rates of Black American women and White women were positive and just slightly below the CLF. Additional targeted recruitment is needed to reach Hispanic American women, Asian American men and women, and American Indian and Native Alaska men. [See Figure 11.] The overall hiring rate in 2016 for minorities and women has been positive with both groups having little statistical disparity from the CLF.
| Figure 11 CEP Hires in 2016 (Classes 53-57) | |||||||||||||
|---|---|---|---|---|---|---|---|---|---|---|---|---|---|
| 2 or More | AIAN | Asian | Black | Hispanic | White | Total | |||||||
| Women | Men | Women | Men | Women | Men | Women | Men | Women | Men | Women | Men | ||
| CEP | 2 | 1 | 2 | 0 | 2 | 2 | 12 | 6 | 0 | 3 | 41 | 75 | 146 |
| % | 1.4 | 0.7 | 1.4 | 0 | 1.4 | 1.4 | 8.2 | 4.1 | 0.0 | 2.1 | 28.1 | 51.4 | 100% |
| CLF | 1 | 0.6 | 0.2 | 0.1 | 3.7 | 3.5 | 8.4 | 3.4 | 3.7 | 3.1 | 28.3 | 44.1 | 100% |
As a significant component of the recruitment strategy for the CEP, FDIC recruiters maintained ongoing relationships with a wide range of colleges and universities. This includes 110 institutions designated as members of the Hispanic Association of Colleges and Universities, Historically Black Colleges and Universities, and other minority-serving institutions, tribal colleges and universities, and institutions with significant student populations of Asian Americans and women.
The FDIC corporate recruiters participated in 200 college career fairs, information sessions, and other recruitment-related campus activities throughout the United States to brand the FDIC and attract the best qualified candidates. In 2016, FDIC recruiters attended 23 national diversity outreach events and three regional outreach events to increase awareness of the FDIC as an employer of choice to professionals and students. Recruitment efforts during 2016 also included the following:
Met with key leaders in Hispanic American, Black American, Asian American, women’s, and veterans’ organizations to create awareness of FDIC careers and identify opportunities to expand outreach to their members.
Participated in three student symposiums and career fairs held by the Association of Latino Professionals For America (ALPFA): the West Regional Symposium with a senior FDIC manager serving on a leadership panel to explain the benefits of choosing a public service career; FDIC recruiters serving as luncheon mentors to provide insight into FDIC employment opportunities and suggestions to students on ways to develop their careers; and at the 2016 ALPFA National Convention where FDIC hosted a panel discussion entitled Financial Savviness for College Students.
Participated at the Adelante 2016 National Leadership Institute where a senior FDIC representative provided the keynote address to participants entitled Thinking Outside of the Box in Today’s Work Environment, and where FDIC recruiters hosted workshops entitled A Career with the FDIC.
Hosted a workshop at the Thurgood Marshall Leadership Institute on Financial Education for students from Historically Black Colleges and Universities.
Provided industry trends and FDIC recruitment statistics to business deans of Historically Black Colleges and Universities during their annual summit, and a senior FDIC manager served on a panel to provide business deans and faculty members with insight on skills students should acquire in college to catapult their careers after graduation.
The FDIC continues to help minorities, women, and students with disabilities prepare for careers in business and finance. During 2016, the FDIC recruited summer interns through the Office of Personnel Management’s (OPM) Pathways Program and the Workforce Recruitment Program for College Students with Disabilities (WRP), as well as advertising intern opportunities in national publications and publications targeted to minorities and women. Over the past several years, the FDIC has been a leader in the federal government in the hiring of WRP students with disabilities, including veterans, and provided summer employment opportunities to six WRP students in 2016.
At the beginning of 2016, the Division of Insurance and Research (DIR) Diversity Working Group (DWG) performed data analytics on the population of schools included in the FDIC Corporate Recruitment Program to calculate diversity ratios and economic/finance degree ratios. The analyses helped align DIR’s recruitment program with its diversity plan. In 2016, six DIR recruiters worked with nine colleges and universities, eight minority-affiliated organizations, and participated in more than 15 on-site events, including outreach events and job fairs. Recruiters actively established relationships with key faculty and staff, and shared job postings with schools and other corporate recruiters.
In addition, the DWG created brochures for the economic research assistant, economic analyst, financial analyst, and policy analyst occupations and distributed these brochures at recruiting and outreach events. The brochures are designed to fulfill two objectives: (1) to increase the effectiveness of candidates to navigate the federal application and interview process; and (2) to improve candidate awareness of FDIC job opportunities beyond the event date. Many job candidates are unfamiliar with the federal process and do not know that valuable resources are available on OPM’s USAJOBS website. By pointing candidates to these resources, candidates have a better chance of navigating the process successfully. Furthermore, many job candidates are not aware that they can sign-up to receive notices from USAJOBS when FDIC positions are posted. The information in the brochures provides candidates with instructions on how the FDIC job postings can be sent to email accounts automatically, resulting in a consistent method of reaching this candidate pool.
Diversity and Inclusion Analytics Dashboard
Included in the FDIC’s Diversity and Inclusion Strategic Plan is the goal to develop structures and strategies to equip FDIC leaders with the ability to manage diversity, measure results, refine approaches on the basis of available data, and institutionalize a culture of inclusion. In addition, after reviewing several financial services industry regulators in 2013, the U.S. Government Accountability Office (GAO) recommended that the agencies report on efforts to measure the progress of their employment diversity and inclusion practices, including measurement outcomes as appropriate, to indicate areas for improvement as part of their annual reports to Congress.3.
To implement its strategic plan and address the GAO recommendation, the FDIC developed a workforce analytics dashboard to provide actionable data to senior leadership on the FDIC workforce by gender and minority status, and by division/office, region, race, ethnicity, occupation, grade level, and employment type (permanent and non-permanent). The analytics dashboard has been an important management tool for diversity and inclusion since being launched on June 20, 2013. It allows FDIC senior leaders to support diversity and inclusion efforts in hiring, promotion and retention, and to identify ways to make improvements over time.
The dashboard was used during 2016 by FDIC divisions and offices to target recruitment activities to increase the pool of minority and women applicants; assess the inclusion of minorities and women at the entry, mid, and senior levels; and evaluate diversity-related issues reported in the Federal Employee Viewpoint Survey. Senior leaders have access to workforce data that are updated quarterly and give them the ability to measure progress and adjust strategies where needed. For example, DCP used the dashboard to monitor the employment of, and to develop strategies to attract, Hispanic Americans to employment in the FDIC; DIR used the dashboard to conduct outreach for its economist occupation; and the Corporate Recruitment Program used the dashboard to direct recruitment activities for the CEP. The FDIC will continue to identify additional enhancements to the dashboard that will permit senior leaders to continue understanding and advancing diversity and inclusion within their organizations.
3. Trends and Practices in the Financial Services Industry and Agencies after the Recent Financial Crisis, GAO-13-238, April 16, 2013
Workforce Development Initiative
Like many other federal agencies, the FDIC faces potential succession management challenges as many of its long-term, experienced employees consider retirement. Introduced in 2014, the FDIC’s Workforce Development Initiative seeks to prepare employees to fulfill current and future workforce capability and leadership roles. This focus will help to ensure that the FDIC has a workforce positioned to meet today’s core responsibilities while preparing to fulfill its mission in the years ahead.
During 2016, the FDIC continued to develop and implement the WDI to address comprehensive succession planning needs and workforce development challenges and opportunities. The WDI is focused on four broad objectives: (1) to attract and develop talented employees across the agency; (2) to enhance the capabilities of employees through training and diverse work experiences; (3) to encourage employees to engage in active career development planning and seek leadership roles in the FDIC; and (4) to build on and strengthen the FDIC’s operations to support these efforts.
In 2017, the FDIC will continue to develop and implement the strategies, programs, and infrastructure to support the attainment of these objectives in meeting its long-term workforce needs. As a member of the WDI workgroup, OMWI helps ensure that minorities and women have an equal opportunity to participate.
Challenges
A key challenge for the FDIC in promoting diversity at all levels of its workforce is the ability to attract and retain minorities and women in its bank examiner workforce. The examiner occupation represents the largest occupational group at the FDIC and accounts for 43.7 percent (2,761) of the FDIC total workforce (6,322). Individuals who began their FDIC careers as examiners tend to occupy a significant percentage of executive and managerial leadership positions at the agency, as well as other non-examiner positions in the FDIC. Thus, representation rates within the examiner workforce are key elements to achieving satisfactory representation rates within the broader FDIC workforce.
Despite the overall success of the CEP in increasing the percentage of women and minorities in the examiner workforce, those percentages still remain significantly below the CLF, such as Asian American men and women, Hispanic American women, and women of two of more races. The attrition data will continue to be monitored and strategies will be developed to improve retention. [See Figure 12.]
| Figure 12 CEP Attrition Rates | |||||||||||||
|---|---|---|---|---|---|---|---|---|---|---|---|---|---|
| Total | 2 or More | AIAN | Asian | Black | Hispanic | White | |||||||
| Women | Men | Women | Men | Women | Men | Women | Men | Women | Men | Women | Men | ||
| Hired | 1665 | 11 | 15 | 4 | 11 | 29 | 52 | 159 | 110 | 30 | 43 | 399 | 802 |
| Involuntary Departures |
30 | 0 | 0 | 0 | 0 | 1 | 1 | 5 | 9 | 1 | 2 | 3 | 8 |
| Involuntary Attrition Rate+ |
1.8 | 0.0 | 0.0 | 0.0 | 0.0 | 3.5 | 1.9 | 3.1 | 8.2 | 3.3 | 4.7 | 0.8 | 1.0 |
| Subtotal | 1635 | 11 | 15 | 4 | 11 | 28 | 51 | 51 | 154 | 29 | 41 | 396 | 794 |
| Transfers (Mid-Career/ Other) | 36 | 0 | 0 | 0 | 0 | 0 | 0 | 4 | 3 | 2 | 1 | 13 | 13 |
| Voluntary Departures | 521 | 2 | 0 | 0 | 1 | 9 | 26 | 58 | 43 | 10 | 15 | 120 | 230 |
| Voluntary Attrition Rate * | 31.9 | 18.2 | 13.3 | 0.0 | 45.5 | 32.1 | 51.0 | 37.7 | 42.6 | 34.5 | 36.6 | 30.3 | 29.0 |
| Number Retained | 1078 | 9 | 13 | 4 | 6 | 19 | 25 | 92 | 55 | 17 | 25 | 263 | 551 |
| + “Involuntary Attrition Rate” is the Involuntary Departures divided by the total hired. * “Voluntary Attrition Rate” is the Voluntary Departures divided by the subtotal. | |||||||||||||
In the non-examiner occupations of attorneys, economists, accountant/auditors, financial administration, and general business and industry, the FDIC faces challenges in attracting and recruiting minorities and women, primarily due to low representation rates for minority groups and women in these occupations. [See Appendix D.]
Overall, minorities fall below the relevant CLF in the economist occupation, with Hispanic American men and Asian American men having particularly low participation rates and Hispanic American women, Black American men, American Indian and Alaska Native men and women, and men and women of two or more races being absent.
For the accountant/auditor occupations, Hispanic American men and women and American Indian and Alaskan Native men and women, and women of two or more races are absent. White women and Asian American men have a low representation compared to the relevant CLF for the accountant/auditor occupation.
In the attorney occupation, the level of representation for some groups is not as pronounced, with Hispanic American men and women, Asian American men, and women of two or more races having participation rates below the relevant CLF.
Women, Hispanic American men and women, White women, and women of two or more races also fall below the CLF in the financial administration and general business and industry occupations. In the general business and industry occupation, Black American men and women, American Indian and Alaska Native women, and Asian American women are slightly below the CLF.
To address the participation rates of the groups noted above in the non-examiner occupations, the FDIC recruitment plan includes strategies intended to increase outreach to prospective applicants in underrepresented groups at the entry, mid, and senior levels in these occupations throughout the agency. The plan includes reaching out to professional organizations, colleges and universities, and affinity groups.
In 2016, the FDIC continued monitoring race, ethnicity, gender, and grade levels by FDIC divisions and offices. As a result, the FDIC continues expanding outreach and recruitment more broadly to increase minority and women representation at senior levels within the FDIC. Also, the FDIC updated and continued implementing its Diversity and Inclusion Strategic Plan, which is designed to develop an integrated view of diversity and inclusion, strategically monitor and manage the employment life cycle (hire to retire), and address challenges at the FDIC.
Other Activities
Status of DFA Section 342 Regulated Entity Requirements
Section 342(b)(2)(C) of the DFA requires the OMWI Director of each federal financial regulatory agency to develop standards for assessing the diversity policies and practices of its regulated institutions.
The FDIC OMWI worked closely with its counterpart OMWI Directors at the Office of the Comptroller of the Currency (OCC), the National Credit Union Administration (NCUA), the Federal Reserve Board (FRB), the Consumer Financial Protection Bureau (CFPB), and the Securities and Exchange Commission (SEC). On June 10, 2015, the OMWI agencies published in the Federal Register the final Interagency Policy Statement Establishing Joint Standards for Assessing the Diversity Policies and Practices of Regulated Entities (Policy Statement).
The Policy Statement reflects input received during a public comment period, as well as information gathered throughout the development process, and is intended to promote transparency and awareness of diversity policies and practices within the financial services industry. Furthermore, the Policy Statement provides a framework for regulated financial institutions to establish, assess, and strengthen their diversity policies and practices.
In 2016, the FDIC continued to collaborate with its counterparts at the OCC, FRB, CFPB, and SEC. These five OMWI agencies received approval from the OMB on February 18, 2016, as required by the Paperwork Reduction Act (PRA), to collect information from their regulated entities. Regulated entities were notified of the collection approval through the Federal Register on July 13, 2016, and were informed that they may now submit self-assessments of their diversity policies and practices to the OMWI Director of their primary federal financial regulator.
During 2016, the FDIC OMWI participated with the other agencies in discussions with financial institutions regarding the requirements of the Policy Statement and, particularly, the self-assessments. Panel discussions were held at the American Bankers Association National Conference, the Massachusetts Bankers Association Human Resources Conference, the Community Bankers Association of Georgia’s Sixth Annual Workplace Conference, the Financial Services Industry Roundtable, and the Mortgage Bankers Association Roundtable hosted by the CFPB.
To facilitate uniform and systematic collection of information, the FDIC developed a diversity self-assessment template for its regulated institutions to use as they assess their diversity policies and practices. After a period of public comment pursuant to the PRA, the FDIC received approval from OMB for the template in early 2017. In addition, FDIC, OCC, and FRB developed Frequently Asked Questions and posted them on each agency’s website as a resource to regulated institutions.
Guidance to the financial institutions strongly encourages them to disclose, on their websites, their diversity policies and practices, as well as information related to their self-assessments, to maximize transparency, and to provide their policies, practices, and self-assessment information to their primary federal financial regulator. In 2016, some FDIC-regulated institutions began conducting self-assessments against the diversity standards and submitting them to the FDIC OMWI Director. The FDIC plans to use self-assessment information provided by its regulated institutions to monitor progress and trends, and to identify and publicize promising diversity policies and practices in the financial services industry. Through inter-agency coordination with the OCC and the FRB, the FDIC will continue communicating with the regulated institutions about the value of conducting the self-assessment, submitting it to the OMWI Director of the primary federal regulator, and making information transparent to the public.
Contractor Workforce
Section 342(c) of the DFA requires that OMWI ensure, to the maximum extent possible, the fair inclusion of minorities, women, and minority- and women-owned businesses in all business activities of the agency, including procurement. Following passage of the DFA, OMWI worked with the Acquisition Services Branch (ASB) and Legal Division to develop a “Fair Inclusion” contract clause for all awards over $100,000. This award amount is the agency threshold for contracts that must follow formal contract award procedures. The clause notifies contractors of the responsibility to include minorities and women in their workforce and advises of remediation action the FDIC may take if it is determined the contractor has failed to do so. OMWI developed the Contractor Workforce Review Process (CWRP) in collaboration with ASB and the Legal Division to assess a contractor’s good faith efforts. The CWRP encompasses existing FDIC procurement policies and practices that support the requirements of section 342(c) of DFA.
The CWRP is the FDIC’s procedural framework to verify that contractors that do business with the FDIC are making good faith efforts to include minorities and women in their workforce. Good faith efforts are defined as actions contractors undertake to identify, and, if present, remove barriers to employment or expansion of employment opportunities for women and minorities. Contractors that seek to do business with the FDIC must provide a written statement, known as the Fair Inclusion Certification, stating their commitment to making a good faith effort. To verify their commitment, agency contractors, upon written request from the FDIC, are asked to provide documentation that supports the actions they have undertaken to demonstrate their good faith effort to ensure the fair inclusion of minorities and women in their workforce.
In 2016, OMWI continued implementation of the CWRP in collaboration with ASB and the Legal Division. Contract files for all new awards were reviewed for the Fair Inclusion clause and to verify receipt of the contractor’s written certification. In March 2016, FDIC was approved under the PRA to collect good faith effort support documentation from agency contractors.
During 2016, OMWI requested support documentation from 40 contractors. Thirty-five of the 40 contractors responded and/or provided good faith effort support documentation, which included a copy of their affirmative action plan, demographic data, and/or other documentation for review. All contractors reviewed had made, or were making, good faith efforts to include women and minorities in their workforces. The five remaining contractors were still under review.
OIG Review of FDIC’s Efforts to Provide Equal Opportunity and Achieve Senior Management Diversity
In 2014, the Ranking Member and Minority Members of the United States House of Representatives Committee on Financial Services requested that the FDIC Office of Inspector General (OIG) perform work related to the FDIC’s efforts to increase senior management diversity. The Members referenced the 2013 GAO report that concluded, among other things, that management-level representation of minorities and women among the federal financial regulatory agencies had not changed substantially from 2007 through 2011, despite the senior management diversity provisions in the DFA. The Members requested that the OIG determine whether agency internal operations and personnel practices were systematically disadvantaging minorities and women from obtaining senior management positions.
Based on their review of the FDIC human resources processes and related efforts to achieve diversity and fairness, the OIG observed that the FDIC faces challenges to increasing workforce diversity overall and at the senior management level due to issues that are difficult for the FDIC to control, including low turnover of existing managers and executives, underrepresentation of women and minorities in internal candidate pools, and competition from the private sector for diverse candidates. The OIG observed that the FDIC has:
developed processes that consider diversity in recruiting, hiring, and promotions;
implemented robust training and leadership development programs;
established controls in its performance management and recognition programs to ensure fairness;
provided employees with several options for appealing personnel decisions and reporting discrimination;
monitored employee separation and termination statistics and reasons for leaving the agency; and
initiated succession planning efforts.
The OIG also observed that there were areas for improvement and made nine recommendations related to recruitment, leadership training, the EOI Program, analysis of performance results, the reliability of diversity data, and relevant EEO policies. The FDIC accepted all nine OIG recommendations and worked throughout 2015 and 2016 to implement recommended actions. The FDIC instituted several initiatives to address the recommendations to include:
formalizing strategic recruiting procedures to better ensure consistent and comprehensive outreach to diverse populations;
establishing processes to measure the success of recruiting efforts;
establishing procedures to track participation rates by gender, race, and ethnicity in the FDIC leadership development programs;
developing policies and procedures for the FDIC EOI program, as well as establishing a process to track EOI application and selection rates by gender, race, and ethnicity; and,
-
enhancing controls to ensure the reliability of the data reported in the FDIC’s Federal Agency Annual EEO Program Status Report by creating and implementing a data validation and verification plan.
During 2016, the FDIC continued to refine and implement strategic actions in response to the recommendations. All of the recommendations have now been incorporated in the FDIC’s human resources and diversity programs and activities.
Promoting Financial Access and Financial Literacy
Financial education helps consumers understand and use bank products effectively and sustain a banking relationship over time. The FDIC continued to be a leader in developing high-quality, free financial educational resources and pursuing collaborations to use those tools to educate the public. The FDIC’s work during 2016 dealt primarily with young people because of the Financial Literacy and Education Commission’s emphasis on the Starting Early for Financial Success program.
Money Smart for Young People, a standards-aligned curriculum designed to involve teachers, students, and parents/caregivers in the learning process about money, was downloaded more than 26,000 times during 2016, its first full year of production. Also, 189 educators at eight school locations received professional development training to assist them in using Money Smart for Young People as part of a pilot project to gain feedback. Input from stakeholders was considered to enhance the curriculum, including making it available to download on a lesson-by-lesson basis.
The Teacher Online Resource Center, the gateway for helpful resources from the FDIC and the CFPB for youth financial education, was enhanced through the addition of five new videos that overview the key features of the curriculum. There were more than 30,000 visits to the site during the year. The FDIC continued to collaborate with strategic partners to increase awareness of free resources. For example, more than 600 people participated in four conference calls/webinars held in collaboration with the Jump$tart Coalition to make educators feel more comfortable in using the curriculum.
The FDIC also completed a report on key lessons from the Youth Savings Pilot Program, which was aimed at identifying and highlighting promising approaches to offering financial education tied to the opening of safe, low-cost savings accounts for school-aged children. The FDIC in 2017 will issue this report, developed from the experiences of the 21 banks that participated in the two-year pilot that will define a range of models that offer banks flexibility to adapt to varying opportunities to promote youth savings. The final report will be a resource for banks, schools, and others interested in enhancing youth financial education efforts through opportunities for young people to open savings accounts.
The FDIC also developed and began to implement strategies to improve financial education and access to mainstream financial services for youth participating in youth employment programs funded through the Workforce Investment Opportunity Act (WIOA). For workforce providers and their partners teaching financial education, the FDIC developed a tool to map Money Smart to WIOA’s financial education element and drafted a Money Smart supplement to prepare youth to open their first accounts. The FDIC also led three webinars in collaboration with the U.S. Department of Labor to increase awareness of Money Smart by some of the organizations that receive federal funding for youth employment. In addition, the FDIC participated in three regional events in collaboration with the Department of Labor and Federal Reserve System to strengthen the capacity of workforce development organizations to work with financial institutions on financial capability initiatives.
Also, the FDIC and CFPB worked on an enhanced version of Money Smart for Older Adults, a free financial education curriculum first released in 2013 to help prevent elder financial exploitation. The enhancements which were issued in March 2017, include updates to the material based on input from trainers and technical updates. The newly updated resource includes an expanded discussion on common types of elder financial exploitation such as tax, charity, debt collection, and grandchild imposter scams. The resource also incorporates other newer federal resources that can be helpful on topics such as how to research an investment advisor.
In 2016, the FDIC provided professional guidance and technical assistance to banks and community organizations through outreach activities and events designed to foster understanding and practical relationships between financial institutions and other community development and economic inclusion stakeholders. The events focused on economic inclusion, community development and Community Reinvestment Act (CRA) events linking bank and community partners with opportunities to address community credit and development needs. A particular emphasis was on low- and moderate-income consumers, including providing access to mortgage credit in underserved markets and small businesses development-related events.
In 2016, OMWI and DCP conducted Money Smart workshops at several events that hosted large populations of Black American, Hispanic American, Asian American, and Native American students and adults. In addition, OMWI conducted six Money Smart for Small Business workshops at the Reservation Economic Summit (RES) sponsored by the National Center for American Indian Enterprise Development. RES is the largest economic event designed to assist, support, and provide resources to American Indian businesses and entrepreneurs.
Also, the FDIC’s Advisory Committee on Economic Inclusion held meetings in 2016. The Committee continued to provide the FDIC with advice and recommendations on important initiatives focusing on expanding access to banking services for underserved populations. A number of initiatives designed to promote economic inclusion have been conducted in consultation with the Committee, including pilot programs to study safe banking accounts and an affordable small-dollar loan program.
Minority Depository Institution Activities
The preservation of minority depository institutions (MDIs) remains a high priority for the FDIC. In 2016, the FDIC continued to advocate for MDI and Community Development Financial Institution (CDFI) industry-led strategies for success. These strategies included: increasing collaboration between MDI and CDFI bankers; partnering to share costs, raising capital, or pooling loans; and making innovative use of federal programs. The FDIC supports these efforts by providing technical assistance to MDI and CDFI bankers.
The FDIC also continues to pursue ways to improve communication and interaction with MDIs and to respond to the concerns of minority bankers. The FDIC maintains active outreach with MDI trade groups and offers to arrange annual meetings between FDIC regional management and each MDI’s board of directors to discuss issues of interest. The FDIC routinely contacts MDIs to offer return visits and technical assistance following the conclusion of FDIC safety and soundness, compliance, CRA, and specialty examinations to assist bank management in understanding and implementing examination recommendations. These return visits, normally conducted 90 to 120 days after the examination, provide recommendations or feedback for improving operations, not to identify new issues. The FDIC’s website encourages and provides contact information for any MDI to request technical assistance at any time.
In 2016, the FDIC sponsored a discussion between trade groups representing MDIs and CDFIs and representatives of potential bank partners, focusing on CRA partnerships. In addition, the FDIC provided technical assistance to a group seeking to develop a private equity fund to invest in MDIs. The FDIC’s assistance addressed how the proposed structure might be considered under the Basel Capital rules as well as the CRA. Both community banks and larger insured financial institutions have valuable incentives under the CRA to undertake ventures with MDIs, including capital investment and loan participations.
In 2016, the FDIC, OCC, and FRB co-hosted a webinar on strategic planning attended by approximately 50 MDIs, and began planning the 2017 Interagency MDI and CDFI Bank Conference, which the agencies will co-sponsor. The conference will be held in Los Angeles where there is a significant concentration of MDIs. The conference will feature an interactive panel with the FDIC Chairman, a Federal Reserve Board Governor, and the Comptroller of the Currency.
In 2016, the FDIC provided 135 individual technical assistance sessions on approximately 60 risk management and compliance topics, including:
Accounting
Bank Secrecy Act and Anti-Money Laundering
Basel III Capital Rules
Brokered Deposits/Waivers
Capital Planning
Commercial Real Estate Concentrations
Community Reinvestment Act
Funding and Liquidity
Global Cash Flow
High Volatility Commercial Real Estate
Information Technology Risk Management and Security
Interest Rate Risk
Loan Underwriting and Administration
Qualified Mortgage Rules
Strategic Planning
Third-Party Risk Management
The FDIC regional offices also held outreach, training, and educational programs for MDIs through conference calls and regional banker roundtables. In 2016, topics of discussion for these sessions included many of those listed above, as well as the FDIC’s National MDI Program, the FDIC’s Community Banking Initiative, and the availability of technical assistance videos on corporate governance, strategic planning, director responsibilities, community banking initiatives, compliance guidance, concentration risk management, and bank merger and acquisition.
Conclusion
During 2016, the FDIC made progress enhancing the diversity of its workforce and business practices.
The racial, ethnic, and gender diversity of the FDIC workforce continues a steady increase since the passage of DFA section 342. Both the percentages for minorities (28.2 percent) and women (45.1 percent) in the FDIC’s permanent workforce grew over the past five years. The FDIC continues to focus on attracting, hiring, and retaining minorities and women in its bank examiner workforce, which is the principal feeder group for a significant percentage of executive and managerial leadership positions at the agency.
With regard to increasing MWOB participation in contracting, the FDIC continued to focus on opportunities for MWOBs in its non-financial recurring services and implemented new procurement strategies that restructured large contracts into smaller contracts to increase MWOB participation and contract awards. The FDIC maintained an aggressive vendor outreach and education program participating in business expos, conducting technical assistance events, and hosting forums on the FDIC’s Owned Assets Marketplace and Auctions Program that resulted in 188 new MWOBs being added to the FDIC Contractor Resource List. Despite the decrease in bank resolution activities, which has been the major source for contracting opportunities and outside legal counsel work, the FDIC has been successful at identifying opportunities for MWOBs and MWOLF participation.
In partnership with the OMWI Directors and staff of the OCC, NCUA, FRB, CFPB, and SEC, the FDIC remained fully engaged in fulfilling the requirements of DFA section 342 by finalizing the Interagency Policy Statement Establishing Joint Standards for Assessing the Diversity Policies and Practices of Entities Regulated by the Agencies, seeking approval to collect information from regulated institutions, and developing resources to assist institutions in responding to the Policy Statement. Furthermore, OMWI implemented the remaining requirements of section 342 regarding the good faith efforts of contractors to include women and minorities in their workforce, and the development of standards for considering race, gender and ethnicity in the FDIC’s workforce.
In every respect, the FDIC’s accomplishments during 2016 are in concert with the requirements of DFA section 342. The FDIC will continue to develop strategies and to capitalize on opportunities to further meet DFA requirements. Specifically, the FDIC will continue to examine requirements for goods and services in the procurement and contracting arena to optimize opportunities to increase MWOB participation, as annual contract awards continue to decline significantly due to the reduction in the number of financial institution failures; and will continue to recruit, hire, and retain the most talented and diverse workforce to sustain its mission.
Appendices
Appendix A
| FDIC Contracting Awards to MWOBs, Five–Year Trend (in millions) | |||||
|---|---|---|---|---|---|
| 2012 | 2013 | 2014 | 2015 | 2016 | |
| Total Awards | $1,041.7 | $572.8 | $686.8 | $858.4 | $508.8 |
| 100.0% | 100.0% | 100.0% | 100.0% | 100.0% | |
| Minority- Owned or Women- Owned Business Totals |
$308.0 | $198.7 | $239.9 | $211.6 | $93.9 |
| 29.6% | 34.7% | 34.9% | 24.7% | 18.5% | |
| Minority- Owned | $261.1 | $158.5 | $143.7 | $145.2 | $56.6 |
| 25.1% | 27.7% | 20.9% | 16.9% | 11.0% | |
| Women- Owned | $90.7 | $66.1 | $132.6 | $104.2 | $47.4 |
| 8.7% | 11.5% | 19.3% | 12.1% | 9.3% | |
| Both Minority- Owned and Women- Owned |
$43.8 | $25.9 | $36.4 | $37.8 | $10.0 |
| 4.2% | 4.5% | 5.3% | 4.3% | 1.9% | |
| Asian American | $92.6 | $38.0 | $27.1 | $51.8 | $25.0 |
| 8.9% | 6.7% | 4.0% | 6.0% | 4.9% | |
| Black American | $105.6 | $32.2 | $21.3 | $30.7 | $9.4 |
| 10.1% | 5.6% | 3.1% | 3.6% | 1.9% | |
| Hispanic American | $50.0 | $85.3 | $66.1 | $43.2 | $20.6 |
| 4.8% | 14.9% | 9.6% | 5.0% | 4.0% | |
| Native American | $9.3 | $0.0 | $0.8 | $0.0 | $0.1 |
| 0.9% | 0.0% | 0.1% | 0.0% | 0.0% | |
| Other Minority | $3.6 | $3.0 | $28.4 | $19.5 | $1.4 |
| 0.4% | 0.5% | 4.1% | 2.3% | 0.3% | |
| FDIC Payments to MWOBs, Five–Year Trend (in millions) | |||||
|---|---|---|---|---|---|
| 2012 | 2013 | 2014 | 2015 | 2016 | |
| Total Contract Payment | $660.0 | $553.7 | $491.6 | $507.2 | $415.2 |
| 100.0% | 100.0% | 100.0% | 100.0% | 100.0% | |
| Minority- Owned | $117.7 | $102.9 | $89.3 | $89.3 | $56.0 |
| 17.8% | 18.6% | 18.2% | 17.6% | 13.5% | |
| Women- Owned | $70.1 | $63.7 | $63.6 | $83.2 | $66.8 |
| 10.6% | 11.5% | 12.9% | 16.4% | 16.1% | |
| Both Minority- Owned and Women- Owned |
$26.4 | $26.0 | $24.7 | $30.0 | $11.3 |
| 4.0% | 4.7% | 5.0% | 5.9% | 2.8% | |
Appendix B
| FDIC 2016 Contract Awards by Top Ten NAICS Codes | ||||
|---|---|---|---|---|
| NAICS | NAICS Description | Dollar Amount of All Awards |
Dollar Amount of MWOB Awards |
% of Dollars to MWOBs |
| 541519 | Other Computer Related Services | $109,900,311.59 | $17,479,314.05 | 15.9% |
| 541611 | Administrative Management and General Management Consulting Services | $77,084,578.46 | $11,890,064.81 | 15.4% |
| 531311 | Residential Property Managers | $44,262,909.00 | $11,214,105.00 | 25.3% |
| 531320 | Offices of Real Estate Appraisers | $26,653,981.95 | $5,486,292.95 | 20.6% |
| 423430 | Computer and Computer Peripheral Equipment and Software Merchant Wholesalers | $25,227,802.58 | $217,753.60 | 0.9% |
| 541511 | Custom Computer Programming Services | $25,196,191.27 | $5,159,074.94 | 20.5% |
| 541512 | Computer Systems Design Services | $20,804,416.35 | $16,637,123.35 | 80.0% |
| 561320 | Temporary Help Services | $18,505,394.16 | $4,840,000.00 | 26.2% |
| 493190 | Other Warehousing and Storage | $17,883,278.80 | $- | 0.0% |
| 561110 | Office Administrative Services | $17,500,000.00 | $- | 0.0% |
| Total | $383,018,864.16 | $72,923,728.70 | 19.0% | |
Appendix C
FDIC Total, Permanent, and Executive Manager Workforce, Five-Year Trend
| Total Workforce (Permanent and Non-Permanent) | ||||||
|---|---|---|---|---|---|---|
| 2012 | 2013 | 2014 | 2015 | 2016 | Change | |
| Minority | 27.8% | 27.5% | 28.1% | 28.2% | 28.0% | +0.2% |
| Non-Minority | 72.2% | 72.5% | 71.9% | 71.8% | 72.0% | -0.2% |
| Men | 56.3% | 56.3% | 55.5% | 55.3% | 55.2% | -1.1% |
| Women | 43.7% | 43.7% | 44.5% | 44.7% | 44.8% | +1.1% |
| Permanent Workforce | ||||||
|---|---|---|---|---|---|---|
| 2012 | 2013 | 2014 | 2015 | 2016 | Change | |
| Minority | 26.9% | 27.3% | 27.6% | 28.0% | 28.2% | +1.3% |
| Non-Minority | 73.1% | 72.7% | 72.4% | 72.0% | 71.8% | -1.3% |
| Men | 55.7% | 55.2% | 55.0% | 54.8% | 54.9% | -0.8% |
| Women | 44.3% | 44.8% | 45.0% | 45.2% | 45.1% | +0.8% |
| Total Workforce - Executive Manager (Permanent and Non-Permanent) | ||||||
|---|---|---|---|---|---|---|
| 2012 | 2013 | 2014 | 2015 | 2016 | Change | |
| Minority | 18.3% | 15.7% | 14.1% | 18.0% | 18.8% | +0.5% |
| Non-Minority | 81.7% | 84.3% | 85.9% | 82.0% | 81.2% | -0.5% |
| Men | 72.5% | 68.6% | 64.1% | 66.9% | 63.2% | -9.3% |
| Women | 27.5% | 31.4% | 35.9% | 33.1% | 36.8% | +9.3% |
Appendix D
2016 FDIC Major Occupations, Total Workforce
| Job Title/Series Occupational CLF |
Race/Ethnicity | ||||||||||||||||
|---|---|---|---|---|---|---|---|---|---|---|---|---|---|---|---|---|---|
| Total Employees |
Hispanic American | Non–Hispanic or Latino | |||||||||||||||
| White | Black American | Asian American | American Indian or Alaska Native |
Two or more races |
|||||||||||||
| All | Men | Women | Men | Women | Men | Women | Men | Women | Men | Women | Men | Women | Men | Women | |||
| Economist (0110) | # | 68 | 44 | 24 | 1 | 0 | 41 | 19 | 0 | 2 | 2 | 3 | 0 | 0 | 0 | 0 | |
| 100.0% | 64.7% | 35.3% | 1.5% | 0.0% | 60.3% | 27.9% | 0.0% | 2.9% | 2.9% | 4.4% | 0.0% | 0.0% | 0.0% | 0.0% | |||
| CLF | 100.0% | 67.1% | 32.9% | 3.3% | 1.9% | 55.8% | 25.5% | 2.8% | 2.7% | 4.4% | 2.7% | 0.2% | 0.1% | 0.6% | 0.4% | ||
| Financial Administration and Program (0501) | # | 185 | 102 | 83 | 4 | 2 | 77 | 35 | 12 | 38 | 6 | 6 | 1 | 2 | 2 | 0 | |
| 100.0% | 55.1% | 44.9% | 2.2% | 1.1% | 41.6% | 18.9% | 6.5% | 20.5% | 3.2% | 3.2% | 0.5% | 1.1% | 1.1% | 0.5% | |||
| CLF | 100.0% | 43.8% | 56.3% | 4.0% | 5.8% | 32.5% | 38.6% | 4.7% | 7.5% | 1.7% | 3.1% | 0.3% | 0.4% | 0.6% | 1.0% | ||
| Accountants and Auditors (0510/0511) |
# | 97 | 47 | 50 | 0 | 0 | 35 | 21 | 8 | 23 | 2 | 6 | 0 | 0 | 2 | 0 | |
| 100.0% | 48.5% | 51.5% | 0.0% | 0.0% | 36.1% | 21.6% | 8.2% | 23.7% | 2.1% | 6.2% | 0.0% | 0.0% | 2.1% | 0.0% | |||
| CLF | 100.0% | 39.9% | 60.1% | 2.2% | 3.9% | 31.8% | 44.2% | 2.4% | 5.6% | 3.0% | 5.4% | 0.1% | 0.3% | 0.4% | 0.7% | ||
| Financial Institution Examining (0570) |
# | 2761 | 1705 | 1056 | 70 | 31 | 1445 | 798 | 113 | 164 | 51 | 45 | 9 | 7 | 17 | 11 | |
| 100.0% | 61.8% | 38.2% | 2.5% | 1.1% | 52.3% | 28.9% | 4.1% | 5.9% | 1.8% | 1.6% | 0.3% | 0.3% | 0.6% | 0.4% | |||
| CLF | 100.0% | 54.8% | 45.2% | 3.1% | 3.7% | 44.1% | 28.3% | 3.4% | 8.4% | 3.5% | 3.7% | 0.1% | 0.2% | 0.6% | 1.0% | ||
| Attorney (0905) | # | 370 | 215 | 155 | 7 | 5 | 187 | 123 | 11 | 14 | 5 | 11 | 2 | 1 | 3 | 1 | |
| 100.0% | 58.1% | 41.9% | 1.9% | 1.4% | 50.5% | 33.2% | 3.8% | 3.8% | 1.4% | 3.0% | 0.5% | 0.3% | 0.8% | 0.3% | |||
| CLF | 100.0% | 66.7% | 33.3% | 2.5% | 1.9% | 59.7% | 26.7% | 2.1 | 2.5% | 1.7% | 1.6% | 0.1% | 0.1% | 0.6% | 0.6% | ||
| General Business and Industry (1101) |
# | 372 | 237 | 135 | 10 | 3 | 197 | 101 | 13 | 22 | 11 | 8 | 1 | 0 | 5 | 1 | |
| 100.0% | 63.7% | 36.3% | 2.7% | 0.8% | 53.0% | 27.2% | 3.5% | 5.9% | 3.0% | 2.2% | 0.3% | 0.0% | 1.3% | 0.3% | |||
| CLF | 100.0% | 36.7% | 63.3% | 2.9% | 5.9% | 27.1% | 43.8% | 3.6% | 8.8% | 2.4% | 3.3% | 0.2% | 0.4% | 0.6% | 1.1% | ||