
Over the past five years, banks have operated in an environment of historically low interest rates. During this time, banks’ balance sheets have evolved in a way that appears to have increased their exposure to rising rates.1 Although it is difficult to predict when interest rates will increase, prudence suggests and supervisory guidance emphasizes the importance of that banks prepare for a period of rising interest rates.
This article describes the changes in the banking industry’s asset mix and funding profile during the sustained low-rate environment and outlines how those changes appear to have resulted in increased interest-rate risk (IRR) exposure. As described in more detail below, concerns center around lengthened asset maturities and a potentially more rate-sensitive mix of liabilities that may expose some banks to securities depreciation and pressures on the net interest margin (NIM) in a rising-rate environment. These trends highlight the importance to banks of proactively managing and addressing IRR. In this regard, the article includes some common pitfalls identified by examiners and recommends strategies that banks can use to better assess and mitigate IRR exposure.
Banking Industry Response to Low-Rate Environment
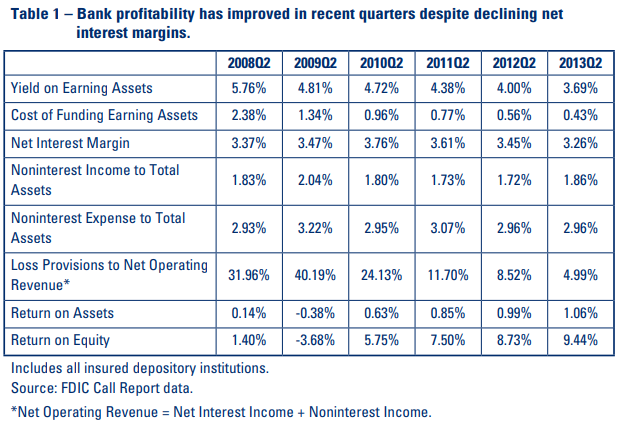
Banks have faced many challenges since the financial crisis. Along with addressing asset quality issues, raising additional capital, and navigating a shifting financial services landscape, institutions have contended with a persistent and exceptionally low interest rate environment. These conditions have influenced changes in asset and funding compositions at many institutions and presented challenges to maintaining profitability. As interest rates have declined, the yield curve has steepened and the availability of retail deposit funding has increased. Banks have benefited from lower interest expense that, in the short term, improved NIMs and buoyed profitability, which was being adversely affected by poor credit quality. However, sustained low rates caused persistent downward pressure on asset yields. Low short-term interest rates also made it difficult to achieve further reductions in interest expense, resulting in deteriorating NIMs. Nevertheless, as shown in Table 1, banks have been able to increase profitability in recent quarters as a result of improved credit quality, reduced noninterest expense, and increased noninterest income. Steps taken to improve earnings performance have overcome declining NIMs and contributed to higher returnon-asset and return-on-equity ratios.
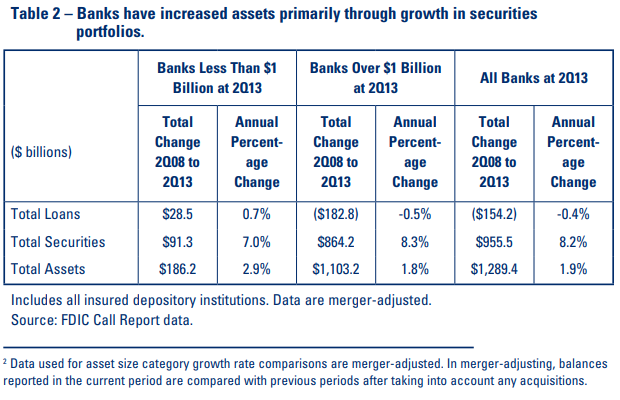
Asset expansion over the past five years has primarily been the result of growth in bank securities portfolios. Securities balances grew by a larger dollar volume and at a considerably faster rate than loans during the five years ending second quarter 2013 (see Table 2).2 During this period the annualized growth rate of securities held by all banks far exceeded (8.2 percent vs. -0.4 percent) the growth rate in loans.
As a result, banks have held increasingly more securities during this time. Total securities as a percentage of total assets increased from 14.7 percent to 20.2 percent for institutions with total assets over $1 billion and from 18.5 percent to 23.1 percent for institutions with total assets less than $1 billion. By comparison, total loans as a percent of total assets declined from 58.8 percent to 52.7 percent for institutions with total assets over $1 billion, and 70.3 percent to 62.5 percent for institutions with total assets under $1 billion.3 Muted loan growth and a shift in the asset mix toward securities may have resulted from modest loan demand and a reluctance to ease credit terms, given the asset quality problems experienced in the aftermath of the crisis.
While securities balances increased, the quarterly annualized yield on securities held by all institutions fell 280 basis points to 2.21 percent from second quarter 2008 to second quarter 2013. This compares to the quarterly annualized yield on loans which fell 134 basis points to 4.94 percent over the same time period.4 Some of this difference can be attributed to the taxable status of investment portfolios, particularly due to a shift to municipal securities that often pay lower yields because of their preferential tax status. During this time, banks with total assets less than $1 billion shifted securities portfolios toward municipal securities. Municipal securities for these institutions represented more than 28 percent of aggregate securities balances at June 30, 2013, after increasing steadily from 19 percent in the same period of 2008. Mortgagebacked securities (MBS) holdings, on the other hand, have not experienced similar growth. MBS comprised almost 40 percent of total securities at June 30, 2013, compared to roughly 43 percent at second quarter 2008.
Even as smaller banks (defined in this paper as banks with total assets under $1 billion) have increased securities holdings, they also have shifted to securities and loans with longer maturities (see Chart 1).
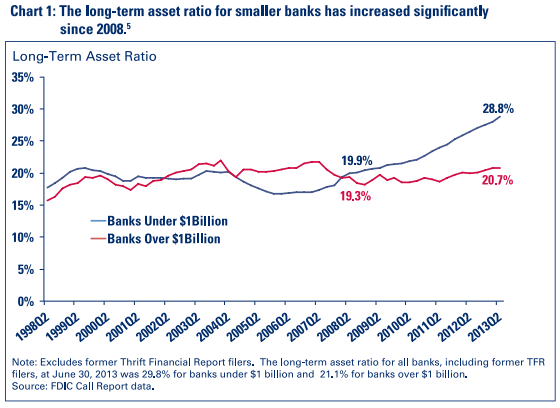
Since second quarter 2008, longer-term assets (defined as loans and securities with remaining maturities or next repricing dates greater than five years) held by smaller banks have increased substantially (from 19.9 percent to 28.8 percent of asset holdings).6 Of these longer-term assets, longer-term securities represent 13.0 percent of assets (up from 9.0 percent at second quarter 2008) and more than half of all securities held by smaller banks. Longer-term loans for these banks represent 15.8 percent of assets (up from 10.9 percent at second quarter 2008). Meanwhile, larger banks with assets over $1 billion have only slightly increased longer-term assets, from 19.3 percent to 20.7 percent at second quarter 2013.
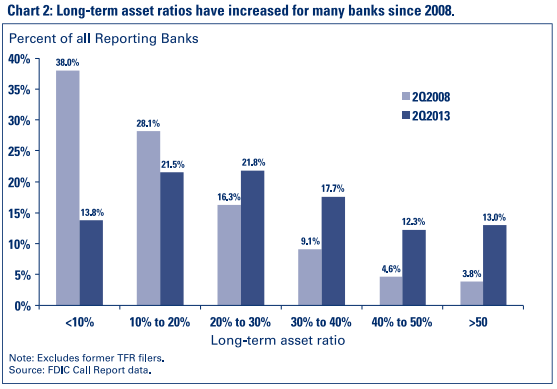
Increasing reliance on longer-term loans and securities has occurred across a significant number of banks as well. As of second quarter 2013, nearly 43 percent of all banks had a long-term asset ratio of at least 30 percent compared to almost 18 percent of all banks at second quarter 2008 (see Chart 2).7
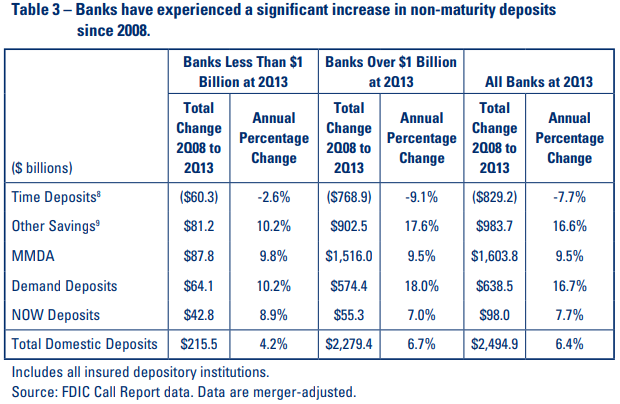
On the liability side of the balance sheet, the banking industry has experienced a surge in deposits since the financial crisis. Domestic deposits held by all banks increased roughly $2.5 trillion from second quarter 2008 through second quarter 2013. This represented an annualized growth rate of 6.4 percent, one percentage point higher than the annual growth rate of domestic deposits for the banking industry over the 15 years prior to second quarter 2008 (see Table 3).
*Time Deposits8
*Other Savings9
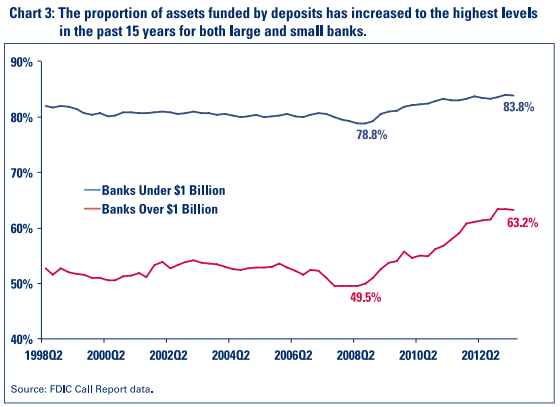
Growth in deposits during the past five years was driven by larger banks, which garnered the majority of deposit volume and saw deposits grow at a faster rate than at smaller banks. Domestic deposits as a percent of total assets also increased substantially for larger banks (see Chart 3). Although growth in domestic deposits for smaller banks may not have been as substantial as it was for larger banks in terms of volume, smaller banks did experience a significant increase in deposits as a percent of total assets. The ratio of domestic deposits to total assets for smaller banks is now at the highest levels in the past 15 years.
The composition of smaller-bank deposits has also changed considerably since 2008. The proportion of noninterest-bearing domestic deposits to total domestic deposits at smaller banks increased from 13.4 percent at second quarter 2008 to 17.7 percent at June 30, 2013. representing the highest levels seen in the past 15 years. Similarly, ratios of money market demand accounts (MMDA), demand deposits, and other savings deposits to total deposits at second quarter 2013 were at their highest levels of the past 15 years. Conversely, smaller-bank time deposits have fallen to 36.5 percent of total deposits as of second quarter 2013, the lowest level recorded in 15 years. Although time deposit balances declined, the duration has increased; time deposit balances at smaller banks currently have longer average maturities than during 2008. The proportion of total time deposits with remaining maturities or next repricing dates over one year increased from 19.6 percent in second quarter 2008 to 35.8 percent in second quarter 2013.10 This shift toward longer-term time deposits was largely driven by higher-balance time deposits as depositors with larger balances sought higher rates through longer-term instruments. Time deposits over $100,000 with remaining maturities over one year increased to 17.2 percent of total time deposits at second quarter 2013 from 6.7 percent five years earlier.11
Meanwhile, the use of brokered deposits and Federal Home Loan Bank (FHLB) advances by smaller banks has declined. Brokered deposits as a percentage of total assets decreased to 2.5 percent at June 30, 2013, from 4.3 percent five years earlier. Similarly, FHLB advances as a percentage of total assets declined from 7.0 percent to 3.2 percent.
Although traditionally stable non-maturity deposit categories have grown in recent years and replaced many traditionally volatile funding sources, such as brokered deposits and FHLB advances, the rapid growth in non-maturity deposit balances may have been exaggerated by persistently low rates. In this regard, traditionally stable deposit categories may have higher rate sensitivity than historical behavior may indicate, especially if persistently low deposit rates have encouraged bank customers to invest in non-maturity products rather than more rate-sensitive products, such as term certificates of deposit. Moreover, some of the increase in deposits could be due to customers’ lack of alternative investments or to non-permanent shifts in customers’ risk profiles, which may change in a rising-rate environment.
We highlight these shifts in the mix and duration of assets and the composition of deposits because they appear to have increased the IRR profile of many banks. Generally, and for reasons discussed further below, the asset side is more exposed to reductions in value in a rising interest rate environment, while the cost of liabilities may be becoming more sensitive to rising rates. These considerations lend added weight to the importance of effective management of IRR exposure.
Sound Practices for Managing IRR Exposure
As discussed above, the sustained low-rate environment has influenced bank balance sheets since the financial crisis and, in many cases, changes to asset and funding structures have increased the need to actively manage IRR exposure. A robust IRR management framework with appropriate policies and procedures that serve to control risk, as well as the capability to quantify and evaluate IRR exposure, remains an integral part of a bank’s risk management framework. However, when assessing their IRR frameworks, banks should keep in mind that effective IRR management need not be overly complex, nor should it rely exclusively on third parties. An understanding of risk exposures and limits by senior bank management and the Board of Directors should play a large role in driving a successful risk management framework.
Banks should measure their IRR exposure in a variety of interest-rate scenarios, including parallel and non-parallel changes, such as flattening or steepening of the yield curve. As highlighted in the 2010 Interagency Advisory on Interest Rate Risk Management, exposures should be tested for substantial rate increases (e.g., 300 and 400 basis points) and incorporate severe but plausible scenarios. Moreover, scenario testing should incorporate assumptions that consider a departure from historical norms, in particular when considering future deposit behavior.
Regulations, Guidance and Resources for Managing IRR
- "Managing Sensitivity to Market Risk in a Challenging Interest Rate Environment”: FIL-46-2013 (October 8, 2013) - https://www.fdic.gov/news/news/financial/2013/fil13046.html.
- FDIC Directors’ video on IRR (2013) - https://www.fdic.gov/regulations/resources/director/virtual/irr.html.
- Interagency “Advisory on Interest Rate Risk Management” (January 6, 2010) – FIL-2-2010 - http://www.fdic.gov/news/news/press/2010/pr1002.pdf and Frequently Asked Questions (January 12, 2012) – FIL-2-2012 - https://www.fdic.gov/news/financial-institution-letters/2012/fil12002a.pdf.
- “Joint Agency Policy Statement on Interest Rate Risk” (May 14, 1996) - https://www.fdic.gov/regulations/laws/rules/fdic-interagency-statements.html
- Interagency Guidelines Establishing Standards for Safety and Soundness (July 10, 1995) - https://www.ecfr.gov/current/title-12/chapter-III/subchapter-B/part-364/appendix-Appendix%20A%20to%20Part%20364.
Banks that have experienced significant changes to their asset or funding mix during the past several years also should consider implementing risk mitigation strategies now to reduce IRR exposure. Such strategies are easier and more cost-effective to implement before a substantial rate movement occurs. In general, mitigation strategies could include shifting the asset and funding mix; diversifying income sources; ensuring capital is adequate to absorb losses should depreciated securities have to be sold; and, for institutions with sufficient understanding and expertise, engaging in hedging activities.12 Banks should establish prudent risk limits that include measurable triggers to help determine when risk mitigation strategies may need to be executed.
Examination Insights – Examiner Focus and Review
The issues described below highlight certain elements of an IRR framework commonly reviewed by examiners during an IRR examination, along with common pitfalls. Importantly, the focus of IRR reviews may vary depending on the unique characteristics of a particular institution. The issues highlighted below are meant only to be illustrative and are not inclusive of all items that may be reviewed or all potential findings. For additional information on expectations for managing IRR, refer to the regulations, guidance, and resources provided above.
| Areas Reviewed by Examiner | Common Pitfalls |
|---|---|
| The adequacy and reasonableness of policies, procedures, risk limits, and strategies governing an IRR framework and the involvement of the Board and senior management in actively reviewing and approving these items. |
|
| The capabilities and accuracy of internal measurement systems and the appropriateness of assumptions and stress-testing scenarios. |
|
| Characteristics and duration of assets, funding sources, and offbalance sheet exposures and their contribution to the overall IRR profile. |
|
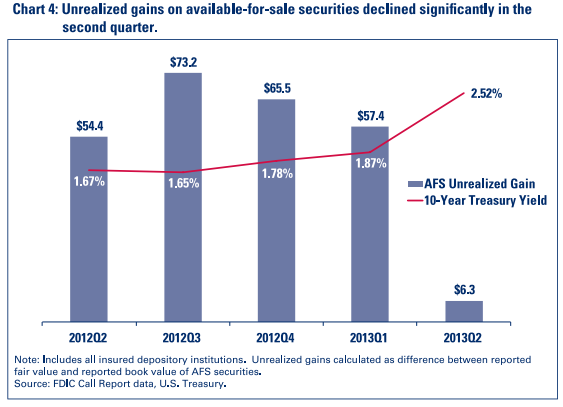
Banks with longer-maturity securities portfolios should prepare for the risk of declining fair values that may come as a result of higher interest rates. Unrealized gains can quickly decline or be transformed into unrealized losses because of increasing rates, as experienced in second quarter 2013 (see Chart 4).
Banks should test securities portfolio exposure to rising rates under significant rising-rate scenarios (e.g., 300 and 400 basis points). As highlighted in Financial Institution Letter (FIL) 46-2013, Managing Sensitivity to Market Risk in a Challenging Interest Rate Environment, although net unrealized losses on securities may not flow through to regulatory capital for most banks, examiners do consider the amount of unrealized losses in the investment portfolio and an institution’s exposure to the possibility of further unrealized losses when qualitatively assessing capital adequacy and liquidity and assigning examination ratings.13 In the event depreciated securities have to be sold, unrealized losses become realized losses, reducing the institution’s regulatory capital position. Furthermore, unrealized losses on available-for-sale and held-to-maturity securities may also reduce equity capital under U.S. generally accepted accounting principles (GAAP). In extreme cases, securities depreciation could exceed equity capital, resulting in a negative GAAP equity position. A significant decline in an institution’s GAAP equity can have negative market perception and liquidity implications. For all of these reasons, significant securities depreciation is an important risk for banks regardless of the regulatory capital treatment, as it can adversely affect earnings, liquidity, and public confidence in the institution.
To alleviate pressure from fair value losses for banks with sizable long-term fixed-rate holdings, management may consider locking in profits in longer-term securities through investment sales and shifts in the investment portfolio’s composition toward shorter-maturity or variable-rate securities.
Similarly, banks that have extended asset portfolio duration to capture higher yields may consider shorter-term or variable-rate products, which are more effective in managing sensitivity and mitigating potential depreciation in the portfolio.
When assessing the IRR exposure of loan portfolios or considering new loan products, it is also important to consider how rate floors or caps may either improve or exacerbate exposure in a rising-rate scenario. If a bank’s variable-rate loans have contractual rate floors that are currently well above prevailing rates, increases in interest rates will not immediately be reflected in those loans – possibly for several hundred basis points – and could potentially increase the bank’s liability sensitivity. Similarly, variable-rate loans that are at or close to their contractual rate caps will not fully benefit from significant increases in interest rates as rates will be held at respective caps regardless of the increase in prevailing rates.
Additionally, banks should consider the impact rising rates will have on cash flow for variable-rate customers, as well as for those customers with near-term maturities, when loans may reprice at higher rates. The IRR management framework and quantitative exposure models should consider the potential for increased losses through credit deterioration stemming from the strain on cash flows of marginal borrowers.
The text box on page 13 depicts the price sensitivity of selected securities to changes in interest rates. The value of long-duration securities can be materially reduced in an environment of substantially rising interest rates. For example, a 10-year Treasury note with a 2.5 percent coupon would lose approximately 23 percent of its value if interest rates increased 300 basis points.
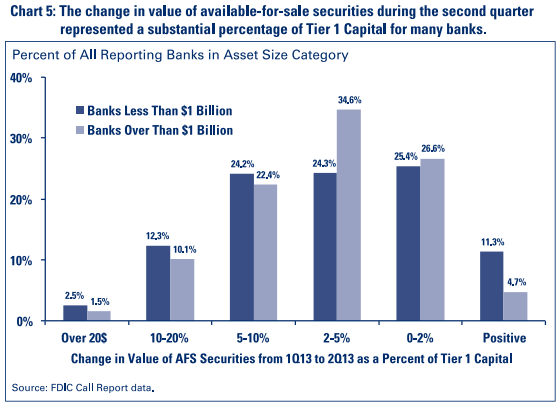
As indicated in Chart 5, market experience in second quarter 2013 illustrated the sensitivity of the values of investment portfolios to rising interest rates across many banks. An increase in rates in the second quarter was accompanied by widespread reductions in the fair values of banks’ investment portfolios, by amounts that exceeded 10 percent of tier 1 capital for nearly 15 percent of all reporting institutions.
Understanding Price Sensitivity Across Security Types
Understanding how price behavior is influenced by changes in interest rates for current securities holdings as well as prospective purchases is a critical component of managing IRR exposure. Banks should fully understand the relationship between rate movements and price sensitivity for securities holdings, in particular for securities with embedded options that may affect price behavior. In general, price sensitivity for an option-free bond is greater for low-coupon, longer-maturity securities compared to high-coupon, shorter-maturity securities. This is because the sooner cash flows are received, the less time they would be subjected to the disparity between their original yield and current market rates, should rates change. Generally, the effects of a longer maturity outweigh the effects of a larger coupon. The example below illustrates price behavior for option-free Treasury securities of varying terms and coupons.
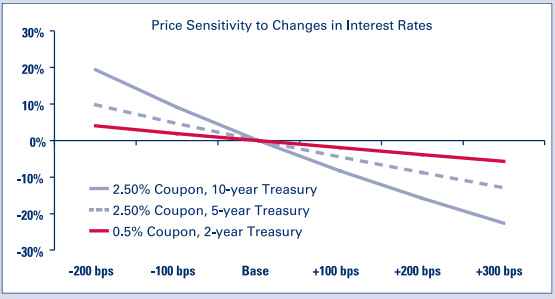
Price behavior of securities with embedded options varies depending on how the underlying option influences cash flows of the particular security. For example, expected cash flows of a mortgage-backed security (MBS) may change as borrowers exercise options to prepay mortgage balances. Similarly, cash flows of a callable bond may be affected if the bond is called at the option of the issuer. Price behavior, total return, and life of these security types will change across interest rate scenarios as a result of the embedded options. The example below compares price behavior across various security types.
| Price Change* | -200 bps | -100 bps | +100 bps | +200 bps | +300 bps | +400 bps |
|---|---|---|---|---|---|---|
| Treasury 2.5%, 10-year | 19% | 9% | -8% | -16% | -23% | -29% |
| Treasury 0.5%, 2-year | 4% | 2% | -2% | -4% | -6% | -8% |
| FNMA 3.5% 30-yr MBS | 6% | 5% | -8% | -15% | -21% | -26% |
| FNMA 3.0% 15-yr MBS | 3% | 3% | -4% | -9% | -13% | -19% |
| FNMA Callable 5-yr Note | 0.9% | 0.5% | -4% | -8% | -12% | -15% |
| FNMA Callable Step Coupon 5-yr Note | 0.4% | 0.2% | -2% | -5% | -8% | -11% |
*Price changes are approximate and intended only to illustrate differences in price behavior across security types. Forecasted price behavior may vary depending on assumptions. Actual price behavior of securities may not precisely reflect those shown above.
Source: Bloomberg.
With respect to liabilities, banks should objectively examine funding and deposit structures. Changes in the level and composition of deposits in recent years should be examined with an understanding of how a sustained low-rate environment may have influenced deposit trends. Deposit products may not behave in the same manner going forward. For example, longer-term time deposits that lock in low rates generally improve a bank’s IRR profile. However, banks should consider the risk that penalties for early termination of time deposits— regardless of maturity—may not be sufficient to deter customers from taking advantage of higher rates if broader interest rates increase. This is a particular concern if the customer only forfeits interest (which can be minimal in the current environment). Additionally, traditionally stable deposit categories may now reflect greater rate sensitivity than previously thought. To the extent that persistently low deposit interest rates have encouraged bank customers to invest in non-maturity products rather than more rate-sensitive products, such as term certificates of deposit, the pricing power that banks have over these deposit categories may be diminished. Moreover, some of the increase in deposits could be due to customers’ lack of alternative investments or non-permanent shifts in customers’ risk profiles, which could reduce the natural ability of some banks’ funding structures to offset rate risk taken via long-term assets. Another factor that could increase the rate sensitivity of non-maturity deposits compared to previous experience is the elimination under the Dodd-Frank Wall Street Reform and Consumer Protection Act of the prohibition of payment of interest on demand deposits.14 This statutory change has had little effect to date because of near-0 percent short-term interest rates. However, in a rising-rate environment, the fact that demand deposits can require interest payments should be considered as part of banks’ planning. Similarly, as noted above, time deposit balances have experienced a shift in composition towards larger balance accounts. Although this shift may have been influenced in part by statutory changes to insurance coverage limits, banks should still be conscious of how a shift towards largerand potentially more sophisticated—accounts may increase rate sensitivity relative to historical experience if time deposit balances previously consisted primarily of smaller accounts.
As shown in Chart 3 (see page 8), deposits are currently funding the highest percentage of assets than at any other time during the past 15 years. Accordingly, the effect on NIMs could be more pronounced if deposit products prove more rate sensitive than historical experience may suggest. Banks should create scenarios that take into consideration how funding mix and interest expense would change if deposit balances shift toward higher rate products, or deposit balances leave the bank altogether and need to be replaced by alternative funding sources. Banks that have experienced a significant increase in deposit balances or a shift in funding mix should consider the potential for reduced pricing power of their deposit products.15 This is particularly important for banks that have extended maturities on the asset side of their balance sheet and depend on these deposits for longer-term funding.
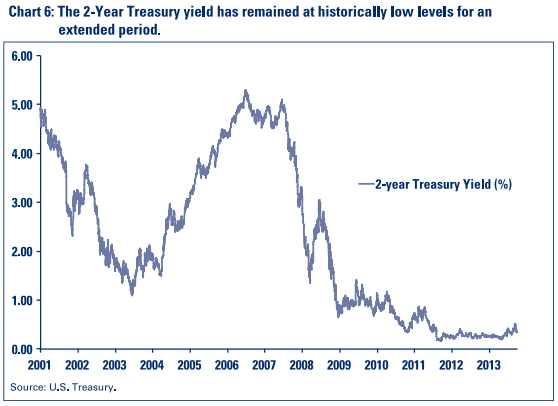
To some extent, banks can use experiences from prior rate cycles to develop appropriate modeling assumptions for assets and liabilities and stress-testing scenarios. However, banks should be mindful of how differences between current and previous interest rate environments may influence outcomes. For example, during the previous rate cycle, prevailing interest rates began to decline in early 2001 before reaching a bottom in 2003, and subsequently rising through 2006 (see Chart 6). The environment in 2003, however, was far different from the current low-rate environment in that rates were not as low, had not dropped as far, and did not stay as low for as long. In the current rate environment, rates began to decline in 2007 before hitting current lows that have been maintained since 2008. As a result of this difference, banks using experiences from the previous rate cycle as a basis for developing assumptions and stresstesting scenarios going forward may not be adequately capturing the risk for a more severe impact of rising rates. Assumptions should be updated to account for the current interest rate environment.
Conclusion
The sustained low-rate environment since 2008 has increased the need to actively manage IRR exposure as a result of shifting asset and liability structures for many banks. Effective policies and procedures that quantify and evaluate IRR exposure remain an integral part of the risk management framework given the challenges presented by the current and prospective environments. On the asset side of the balance sheet, industry data show expanding securities holdings and extending maturities of loan and securities portfolios. This has increased the risk of substantial unrealized losses and extended periods of below-market yields on these assets in a rising-rate environment.
On the liability side, a significant surge in deposits since 2008 has pushed reliance on deposit funding to the highest level in the past 15 years, while the deposit mix has shifted toward non-interest and other non-maturity deposit balances. This has added uncertainty to the pricing power banks have over these funding sources. Banks should be prepared for some customers to respond to a rising-rate environment by moving investments into higher-yielding products which may or may not be offered by the bank. Banks should address such adverse scenarios in the assumptions used to gauge asset and liability IRR exposure to ensure they are adequately prepared for a period of rising interest rates. Through proactive steps to manage and mitigate IRR exposure, bank management should implement effective strategies that will preserve earnings and capital when faced with rising rates.
Andrew D. Carayiannis
Financial Analyst
Division of Risk Management Supervision
acarayiannis@fdic.gov
The author would like to thank these individuals for their valuable contributions to this article:
Lucas D. McKibben
Financial Institution Examiner
Ryan R. Thompson
Financial Institution Examiner
1 Unless otherwise noted, “bank” and “institution” refer to insured depository institutions.
2 Data used for asset size category growth rate comparisons are merger-adjusted. In merger-adjusting, balances reported in the current period are compared with previous periods after taking into account any acquisitions.
3 Unless otherwise noted, the term “total loans” in this article refers to gross loans and leases, net of unearned income.
4 Yield on securities is calculated as total quarterly annualized securities interest and dividend income as a percent of average total securities. Yield on loans is calculated as total quarterly annualized interest and fee income on loans and leases as a percent of average gross loans and leases.
5 Long-term asset ratio is calculated as total loans and securities with maturities or repricing dates greater than five years, as a percent of total assets. This ratio does not include “Other mortgage-backed securities” reported in Call Report Schedule RC-B as having an expected average life over three years.
6 Unless otherwise noted, maturity analysis in this article excludes former Thrift Financial Report (TFR) filers, which were not required to report maturity data. Current trends toward longer-term asset holdings are more significant when considering former TFR filers.
7 For this analysis, a long-term asset ratio of 30 percent or greater was considered to be an elevated level of long-term asset holdings.
8 Includes time deposits of all sizes.
9 Comprises all savings deposits other than MMDAs, and includes regular passbook accounts.
10 Excludes former TFR filers.
11 A shift toward higher-balance time deposits has been influenced, in part, by changes in deposit insurance coverage limits. The FDIC insurance coverage limit was temporarily increased from $100,000 to $250,000 on October 10, 2008, and the coverage limit was made permanent by the enactment of the Dodd-Frank Wall Street Reform and Consumer Protection Act, Public Law 111-203. See http://www.fdic.gov/news/news/press/2008/pr08093.html and http://www.fdic.gov/deposit/deposits/changes.html.
12 Hedging with interest rate derivatives is a potentially complex activity that can have unintended consequences, including compounding losses, if used incorrectly.
13 Under the current general risk-based capital rules, most components of accumulated other comprehensive income (AOCI) are not reflected in a banking organization’s regulatory capital. Under the Basel III capital rules, all banking organizations must recognize in regulatory capital all components of AOCI, excluding accumulated net gains and losses on cash-flow hedges that relate to the hedging of items that are not recognized at fair value on the balance sheet. Banking organizations, other than advanced approaches banking organizations, will be able to make a one-time election to opt out of this treatment and continue to neutralize changes in AOCI, as is done under the current capital rules. The one-time election provided to non-advanced approaches banking organizations must be made with the filing of the March 31, 2015 Call Report. Recognition of changes to AOCI within capital calculations will start in 2014 for advanced approaches banking organizations and 2015 for non-advanced approaches banking organizations that did not opt out of the Basel III treatment.
14 Section 627(a) of Dodd Frank Wall Street Reform and Consumer Protection Act. See https://www.federalregister.gov/documents/2011/07/18/2011-17886/prohibition-against-payment-of-interest-on-demand-deposits.
15 Pricing power, in this context, should consider the ability to retain deposit levels while simultaneously increasing their yield more slowly and by a lower amount than other market rates.