
DIF Balance Sheet - Fourth Quarter 2023
| Balance Sheet | |||||
|---|---|---|---|---|---|
| Dec-23 | Sep-23 | Quarterly Change | Dec-22 | Year-Over-Year Change | |
| Cash and cash equivalents | $4,873 | $30,230 | ($25,357) | $2,599 | $2,274 |
| Investment in U.S. Treasury securities | 18,929 | 52,215 | (33,286) | 122,442 | (103,513) |
| Assessments receivable | 3,236 | 3,273 | (37) | 2,159 | 1,077 |
| Special Assessments receivable | 20,423 |
16,274 |
4,149 |
0 |
20,423 |
| Interest receivable on investments and other assets, net | 146 |
350 |
(204) |
688 |
(542) |
| Receivables from resolutions, net | 97,778 |
158,395 |
(60,617) |
521 |
97,257 |
| Property and equipment | 319 |
368 |
(49) |
360 |
(41) |
| Operating lease right-of-use assets | 81 |
79 |
2 |
93 |
(12) |
| Total Assets | $145,785 |
$261,184 |
($115,399) |
$128,862 |
$16,923 |
| Accounts payable and other liabilities | 410 |
401 |
9 |
269 |
141 |
| Operating lease liabilities | 102 |
100 |
2 |
111 |
(9) |
| Liabilities due to resolutions | 22,513 |
140,311 |
(117,798) |
0 |
22,513 |
| Postretirement benefit liability | 256 |
232 |
24 |
232 |
24 |
| Contingent liability for anticipated failures | 726 |
801 |
(75) |
31 |
695 |
| Contingent liability for litigation losses | 0 |
0 |
0 |
1 |
(1) |
| Total Liabilities | $24,007 |
$141,845 |
($117,838) |
$644 |
$23,363 |
| FYI: Unrealized gain (loss) on U.S. Treasury securities, net | (29) |
(667) |
638 |
(2,985) |
2,956 |
| FYI: Unrealized postretirement benefit (loss) gain | 10 |
27 |
(17) |
27 |
(17) |
| Fund Balance | $121,778 |
$119,339 |
$2,439 |
$128,218 |
($6,440) |
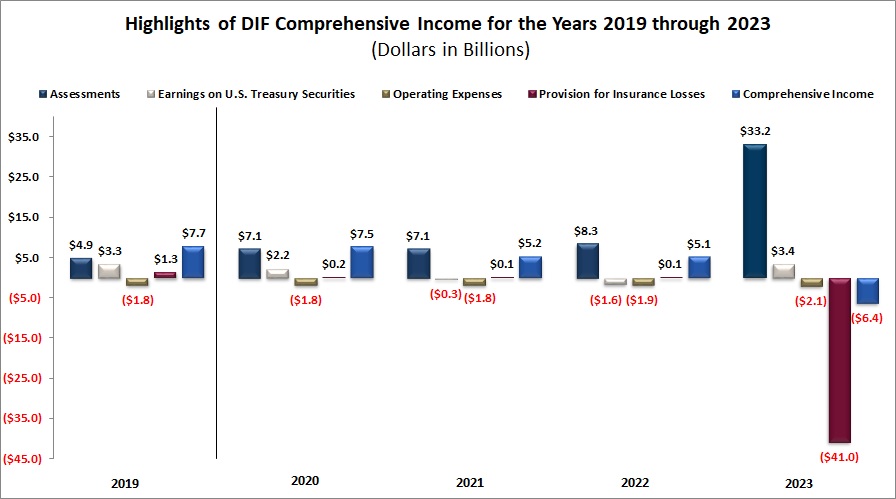
In 2023, the DIF’s comprehensive loss totaled $6.4 billion compared to comprehensive income of $5.1 billion in 2022. The year-over-year change of $11.5 billion was primarily due to a $41.0 billion increase in provision for insurance losses and a $2.3 billion realized loss on sale of U.S. Treasury (UST) securities, partially offset by a $24.9 billion increase in assessment revenue, a $5.8 billion increase in UST securities market valuation adjustments and a $1.5 billion increase in interest revenue from UST securities.
| 2019 | 2020 | 2021 | 2022 | 2023 | |
|---|---|---|---|---|---|
| Assessments | $4.9 | $7.1 | $7.1 | $8.3 | $33.2 |
| Earnings on U.S.T. Securities | $3.3 | $2.2 | ($0.3) | ($1.6) | $3.4 |
| Operating Expenses | ($1.8) | ($1.8) | ($1.8) | ($1.9) | ($2.1) |
| Provision for Insurance Losses | $1.3 | $0.2 | $0.1 | $0.1 | ($41.0) |
| Comprehensive Income | $7.7 | $7.5 | $5.2 | $5.1 | ($6.4) |