
Analysis of Diversity Self- Assessments for 2020

Executive Summary: 2020 Diversity Self-Assessment
Since 2016, the FDIC’s Financial Institution Diversity Self- Assessment (FID-SA) program has supported the efforts of supervised institutions to create and grow their diversity programs, which allow them to build strong relationships with their clients and communities, maximize workforce representation, and develop and implement inclusion efforts. The FDIC developed the diversity self-assessment framework based on the Joint Standards for Assessing our Regulated Entities’ Diversity Policies and Practices that we established with five other federal agencies.
The FID-SA gathers reliable data that can be used to inform management decision making on diversity, equity, and inclusion (DEI) goals and strategies, and allows organizations to set benchmarks and track and communicate progress. The program also allows the FDIC to learn about supervised institutions’ diversity programs and challenges, which puts us in a better position to provide effective technical assistance.
This report presents the key 2020 Diversity Self-Assessment results and offers suggestions that may help financial institutions build better relationships with their employees, customers, and communities.
For the 2020 reporting period, 148 FDIC-supervised financial institutions voluntarily participated in the diversity selfassessment (representing 19 percent of invited institutions). Participating financial institutions represent 38 percent of the total employees and 39 percent of the total assets ($3.3 billion) held by invited FDIC-supervised financial institutions. More than half of the participating financial institutions had also submitted a self-assessment for the 2019 reporting period.
For the 2020 reporting period, we identified some promising trends and areas for improvement where we can provide technical assistance.
Workforce Demographics: Growing Minority and Gender Representation
Financial institutions’ workforce demographics showed a general upward trend in minority1 and gender representation across all categories between 2019 and 2020.
Key Results:
- Minority representation in the total workforce increased from 33 percent to 46 percent. Among management roles, minority representation grew from 11 percent to 18 percent.
- Representation of women in management positions increased from 34 percent to 48 percent, with a slight increase from 16 percent to 20 percent at the board level among the responding financial institutions.
We attributed improved minority and gender representation by participating institutions to the continued upward trend in positive responses on questions about leadership support and board-level commitment to workforce DEI.
The strongest DEI programs share the following characteristics: leadership commitment, a DEI policy/plan, focus on workforce and workplace inclusion, and supplier diversity strategies to ensure diverse supplier base for procurement of goods and services.
1 As defined in section 1204(c) of the Financial Institutions Reform, Recovery, and Enforcement Act of 1989 (12 USC 1811 note), the term “minority” means any Black American, Native American, Hispanic American, or Asian American.
Supplier Diversity, Diverse Candidate Outreach, and Information Sharing Need Greater Prioritization
Overall, since 2016, the assessment results have shown an upward trend in financial institutions affirming their commitment to DEI and workforce diversity, however work remains in several essential areas.
Key Results:
- Many financial institutions have not instituted a Supplier Diversity Policy.
- Some financial institutions fail to conduct outreach to diverse candidates and communities that foster diverse applicant pools for employment opportunities.
- Financial institutions remain reluctant to share information on the organization’s diversity program and performance with the public.
The lack of focused strategies in the above areas, will impact the overall effectiveness of DEI programs. Despite these weak spots, many financial institutions indicated that they have plans to adopt DEI practices, have plans to re-evaluate their current DEI practices in the future, or recognized that their organization needs to do more to improve diversity and inclusion.
2020 Assessment Results
The results are based on participating financial institutions’ reporting within the Diversity Self-Assessment of FDIC-Regulated Financial Institution instrument framework. We developed the diversity self-assessment (DSA) form to support FDIC-supervised financial institutions’ efforts to assess their diversity policies and practices and inform decision-making on building and maintaining a DEI program. By participating in the DSA, financial institutions obtain actionable data that can allow them to:
- Build an Inclusive Work Culture,
- Demonstrate Commitment to Workforce Diversity and EEO,
- Establish a Supplier Diversity Policy,
- Publish Information on DEI Progress, and
- Assess Performance for Continuous Improvement.
In reporting the results, we aggregated the financial institutions’ affirmative responses across the underlying assessment factors for each of the five Standards as a measure of demonstrated commitment. Financial institutions’ “Yes” responses to the relevant assessment factors measure the level of support for each of the Standards across all the institutions.2 In addition to the responses on the assessment factors, the assessment collects data on workforce demographics regarding the total workforce, management, and board-level diversity.
2 The percent result for each standard represents the average across all participating financial institutions’ responses on each assessment factor unless otherwise indicated in the narrative.
Workforce Demographics
Workforce demographics are an important indicator of our financial institutions’ DEI efforts. This data informs management about their current workforce diversity and highlights areas of opportunity in the talent pipeline. Further, it helps to identify opportunities to expand access to available talent in the labor market that can be used for strategies such as succession planning.3
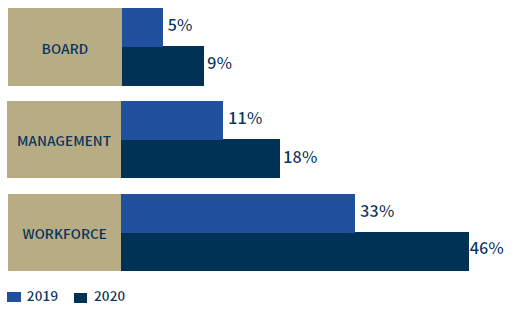
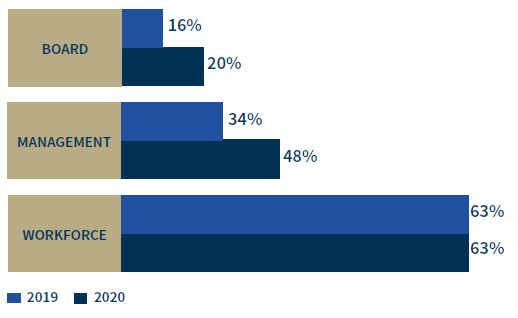
The aggregated workforce demographic results showed improved minority and women representation between 2019 and 2020. We observed that a majority, or 72 percent, of the financial institutions that completed an assessment in 2019 participated in 2020. The reporting showed a significant increase in minority representation in the total workforce and management. Across financial institutions that participated both years, minority workforce representation increased 13 percentage points, from 33 percent to 46 percent. The increase in minority representation at the management level was seven percentage points higher, increasing from 11 percent to 18 percent. During the same period, women representation in management increased to 48 percent, up from 34 percent the previous year. Despite these workforce diversity improvements, financial institutions reported only slight increases in boardlevel representation for minorities and women. Figure 1 shows changes in the workforce demographics since the 2019 reporting period.4 This improvement in representation aligns with improvement in financial institutions certifying commitment to DEI and workforce diversity.
3 US Government Accountability Office (2021). Financial Services Industry: Using Data
to Promote Greater Diversity and Inclusion, available at https://www.gao.gov/assets/gao-21-448t.pdf.
4 For 2020, 92 financial institutions that completed a diversity self-assessment also
participated in 2019.
Figure 1:
Workforce Demographics for Participating
Financial Institutions in Both 2019 and 2020
| Minority Workforce Demographics | |||
|---|---|---|---|
| Board | Management | Workforce | |
| 2019 | 5% | 11% | 33% |
| 2020 | 9% | 18% | 46% |
| Minority Workforce Demographics | |||
|---|---|---|---|
| Board | Management | Workforce | |
| 2019 | 16% | 34% | 63% |
| 2020 | 20% | 48% | 63% |
While workforce demographics remain a key metric, in recent years, many studies have shown that without inclusion and equity, diversity strategies have limited long-term success. Organizations must also create a workplace culture that is inclusive, welcoming of diverse talent, and have a structure where all employees believe they have an equitable opportunity to succeed.
Diversity and Inclusion Reporting Trends (2016 – 2020)
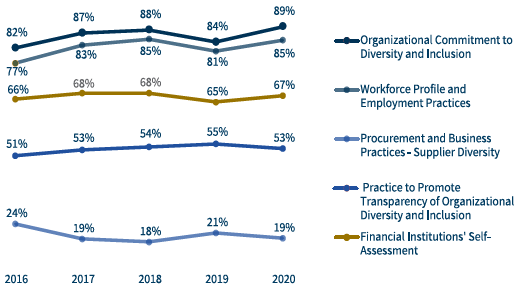
DEI reporting trends among financial institutions have remained steady since 2016. As shown in Figure 2, we continue to see an upward trend in financial institutions that reported making a commitment to building an inclusive culture and diverse workforce reflective of the communities they serve. In comparison, we saw little change in the number of financial institutions that reported sharing information on their diversity efforts’ progress, with slight increases or decreases over the years. For 2020, the assessment results continue to show that fewer than 20 percent of participating financial institutions have a formal Supplier Diversity Program in place.
Diversity Self-Assessment Reporting Trends (2016 – 2020)
| Diversity Self Assessment 2016-2019 Reporting Periods | |||||
|---|---|---|---|---|---|
| Reporting Periods | Organizational Commitment to Diversity and Inclusion | Workforce Profile and Employment Practices | Procurement and Business Practices - Supplier Diversity | Practice to Promote Transparency of Organizational Diversity and Inclusion | Financial Institutions' Self-Assessment |
| 2016 | 82 | 77 | 66 | 51 | 24 |
| 2017 | 87 | 83 | 68 | 53 | 19 |
| 2018 | 88 | 85 | 68 | 54 | 18 |
| 2019 | 84 | 81 | 65 | 55 | 21 |
| 2020 | 89 | 85 | 67 | 53 | 19 |
Standard 1: Organizational Commitment to Diversity and Inclusion
Responses to this Standard reflect how the leadership of an organization demonstrates its commitment to diversity and inclusion. The commitment starts with senior leadership, including the board of directors and cascades throughout the organization through the adoption of policies, practices, and procedures that align with leadership’s vision. Management must proactively communicate the importance of DEI and embed DEI into employment practices and business operations.
Key Results:
- In 2020, 89 percent of participating institutions reported affirming their organizational commitment to DEI, representing a five percentage point increase from 2019.
- Ninety-two percent of participating institutions stated their organization had designated a Diversity Officer or other official responsible for DEI.
- Many institutions reported that they consider DEI as part of their strategic planning, training, and employment systems.
Despite a strong overall performance on organizational commitment, several financial institutions stated they did not have a formal DEI policy or did not provide regular diversity reporting to senior leadership or the board of directors. Below are the aggregate results for each assessment factor.
Below are the aggregate results for each assessment factor.
Assessment Results: Organizational Committment
1.1. The financial institution includes diversity and inclusion considerations in both employment and contracting as an importan part of its strategic plan for recruiting, hiring retention, and promotion.
1.2. The financial institution has a diversity and inclusion policy that is approved and supported by senior leadership, including senior management and the board of directors.
1.3 The financial institution provides regular progress reports to the board and senior management.
1.4 The financial institution regularly conducts training and provides educational opportunities on equal employment opportunity and on diversity and inclusion.
1.5 The financial institution has a senior level official, preferably with knowledge of and experience in diversity and inclusion policies and practices, who oversees and directs the financial institution’s diversity and inclusion efforts.
1.6 The financial institution takes proactive steps to promote a diverse pool of candidates, including women and minorities, in its hiring, recruiting, retention, and promotion, as well as in its selection of board members, senior management, and other senior leadership positions.
Average: Yes (89%); No (11%)


Most financial institutions (92 percent) stated the organization had a Diversity Officer (DO) or designated official responsible for DEI. The existence of a DO as a member of the leadership team provides subject matter expertise and maintains the organization’s focus on DEI programming. While important, the DO cannot be solely responsible for sustained culture change. The front-line managers who interact with employees and customers daily also play a critical role in creating an inclusive culture.
Diversity Policy and Reporting
Despite the overall high ratings for this Standard, we see opportunities for financial institutions to continue to enhance their programs in two key areas. First, financial institutions need to establish a formal DEI policy, and second, they should provide regular diversity reporting to senior leadership and the board.
A formal diversity policy communicates to employees, customers, and the general public the organization’s commitment to building a more inclusive and diverse culture that values the contribution of all employees. We observed that 80 percent of financial Institutions affirmed the existence of a policy. However, financial institutions’ comments most often referenced the existence of an equal employment opportunity (EEO) policy. An EEO Policy is generally focused on compliance and the legal requirements of eliminating discrimination. It cannot substitute for a diversity policy, which speaks to matters beyond legal compliance. For example, the policy should reflect the values of the organization and articulate the importance of diversity. An example of a strong diversity policy from the Society for Human Resource Management (SHRM) is available as an Appendix to this report. Financial institutions may use the template as a starting point and modify it to meet their needs.
The second opportunity for improvement is in the area of reporting. Leading organizations have a process for regular reporting to senior leadership to keep them informed and engaged in DEI. The reporting frequency can vary from as needed to annually. We observed that most institutions (47 percent) only reported annually to senior management and the board. Depending on the financial institutions’ size and structure, more frequent reporting may be warranted. For example, an institution may incorporate DEI data with its quarterly management reports in order to monitor ongoing progress. If there is a designated Diversity Officer, that individual may work with senior leaders and managers to determine the optimum reporting frequency to inform the decision making process.
Standard 2: Workforce Profile and Employment Practices
Responses to this Standard reflect how financial institutions promote the fair inclusion of minorities and women in their workforce by publicizing employment opportunities, creating relationships with minority and women professional organizations and educational institutions, creating a culture that values the contribution of all employees, and encouraging a focus on these objectives when evaluating the performance of managers. Financial institutions with successful diversity and inclusion programs also regularly evaluate their programs and identify areas to be improved.
Key Results:
- In 2020, 85 percent of responding financial institutions had adopted policies and practices to promote workforce diversity.
- There was a noticeable decline in the three assessment factors that address outreach practices that promote diverse applicant pools for both internal and external opportunities.
The assessment results found that the 85 percent mark is an increase of four percentage points over 2019. Financial institutions demonstrated their commitment by providing equal employment opportunities for employees and candidates, using quantitative and qualitative metrics to assess efforts, and aligning DEI with business strategies on the manager’s performance plans. Below are the aggregate results for each assessment factor.
Assessment Results: Workplace Profile and Employment Practices
2.1 The financial institution implements policies and practices related to workforce diversity and inclusion in a manner that complies with all applicable laws.
2.2 The financial institution ensures equal employment opportunities for all employees and applicants for employment and does not engage in unlawful employment discrimination based on gender, race, or ethnicity.
2.3 The financial institution has policies and practices that create diverse applicant pools for both internal and external opportunities that may include:
2.3(a) Outreach to minority and women organizations.
2.3(b) Outreach to educational institutions serving significant minority and women student populations.
2.3(c) Participation in conferences, workshops, and other events to attract minorities and women and to inform them of employment and promotion opportunities.
2.4 The financial institution utilizes both quantitative and qualitative measurements to assess its workforce diversity and inclusion efforts.
2.5 The financial institution holds management at all levels accountable for diversity and inclusion efforts, for example, by ensuring that such efforts align with business strategies and individual performance plans.
Average: Yes (85%); No (15%)


Outreach to Minorities and Women
Despite the overall high Standard rating, we observed a decline in the financial institutions’ “Yes” responses to the assessment factors promoting outreach for employment opportunities. We highlighted these areas as opportunities for financial institutions to continue growing and developing their diversity programs. Further, financial institutions identified some outreach challenges they faced attracting minorities and women for opportunities, including:
- Lack of outreach policies and practices in place for creating diverse applicant pools,
- Limited or postponed outreach activities for the year due to the COVID-19 pandemic restrictions,
- Limited availability of conferences and workshops in rural communities, and
- No/limited educational institutions serving minority and women student populations in the community.
The assessment results indicated that financial institutions in small rural communities may not have the same access to diverse talent as larger financial institutions or institutions in metropolitan areas. However, effective outreach can focus on areas other than demographic diversity and institutions should look for partnership opportunities with organizations that can expand their population reach. These partnerships may include outreach to churches, veterans, civic, and other groups that target historically underserved groups in their communities.
In addition, maintaining good demographic and socioeconomic data on the surrounding communities is important for helping financial institutions define diversity and the community needs that are within their area of influence. This information can inform decisions they make about possible growth opportunities and mitigation strategies for addressing gaps when considering the available resources needed to support outreach. To make efforts more effective, demographic data may be used to identify possible organizations, schools, and events that the financial institutions can include in their outreach strategy.
A free resource available for compiling community demographic data is the United States Census Bureau’s Advancing Equity with Data website.
In addition, participating financial institutions shared practices that may help other institutions promote workforce diversity, including:
- Strengthening the bank’s relationship with minority or lowand moderate-income communities by providing financial literacy training and internship programs (e.g., FDIC Money Smart Alliance).
- Hosting mentoring events where college students learn about the organization’s diversity program; build relationships with human resources and hiring managers; and receive coaching on interview skills and résumé writing, the application process, and effective networking.
- Building relationships with majority-minority institutions to build a talent pipeline, developing an internship and scholarship program, and participating in on-campus recruiting events.
- Forming Employee Resource Groups to assist in developing and deepening partnerships in the community.
- Hiring minority and women recruiters or firms to help identify diverse talent for vacancies.
- Sponsoring a virtual event where bank management discusses the bank’s employment opportunities and goals for developing a diverse talent pipeline for full-time and part-time permanent employees.
- Sponsoring women leaders in an emerging leaders program for career development.
Standard 3: Procurement and Business Practices - Supplier Diversity
Responses to this Standard reflect how organizations increasingly understand the competitive advantage of having a broad selection of available suppliers to choose from with respect to factors such as price, quality, attention to detail, and future relationship building. Leading DEI organizations understand the benefits of maintaining a diverse vendor pool for contracting opportunities. Organizations that expand contracting opportunities benefit from increased innovation, competition, and cost savings. These organizations maintain a formal supplier diversity policy that guides the program’s purpose, scope, goals, and strategies and provides metrics for monitoring program performance.
Key Results:
- In 2020, 19 percent of participating institutions had adopted supplier diversity policies and practices.
- Thirty-nine percent reported having a Supplier Diversity Officer or equivalent designated official.
- Forty-nine percent of FDIC’s largest participating supervised financial institutions had adopted supplier diversity leading practices.
A key takeaway from the assessment results was the importance of having a formal supplier diversity policy. Leading DEI organizations establish a policy that defines their supplier diversity program’s goals, scope, and strategies for promoting opportunities with diverse businesses. We observed that financial institutions that did not affirm compliance with the Standard often stated they lacked a supplier diversity policy that addressed outreach to diverse businesses, procedures to track spending with businesses, and participation in conferences, workshops, or other events to attract minority-owned and women-owned firms for contracting opportunities.
A few institutions stated they were in the process of hiring a Supplier Diversity Officer to lead their program. The lack of procedures and a mission for supplier diversity make it difficult for financial institutions to maximize DEI efforts and gauge progress over time. Below are the aggregate results for each assessment factor.
Assessment Results: Supplier Diversity
3.1 The financial institution has a supplier diversity policy that provides for a fair opportunity for minority-owned and women-owned businesses to compete for procurement of business goods and services.
3.2 The financial institution has methods to evaluate its supplier diversity, which may include metrics and analytics related to: 3.2(a) Annual procurement spending
3.2(b) Percentage of contract dollars awarded to minority-owned and women-owned businesses by race, ethnicity, and gender.
3.2(c) Percentage of contracts with minority-owned and women-owned business subcontractors.
3.3 The financial institution has practices to promote a diverse supplier pool, which may include:
3.3(a) Outreach to minority-owned and women-owned contractors and representative organizations.
3.3(b) Participation in conferences, workshops, and other events to attract minority-owned and women-owned firms and inform them of contracting opportunities.
3.3(c) An ongoing process to publicize its procurement opportunities.
Average: Yes (19%); No (18%)


We note that financial institutions may struggle with where and how to start a supplier diversity program. To assist our financial institutions, the FDIC prepared “Guidance to Procurement and Business Practices,” which leverages information from responding financial institutions to highlight effective supplier diversity practices. The guide is available as a resource on the Financial Institution Diversity Program website. In addition, the FDIC has maintained a Minority and Women Outreach Program since the late 1980s. Supervised financial institutions are encouraged to visit our website and send questions to the mwoboutreach@fdic.gov mailbox to learn more about our program and how we got started.
Large Financial Institutions
Further, analysis of the data by asset size revealed that financial institutions with more than $10 billion in assets were more likely to have a supplier diversity program. For 2020, 14 (or 9 percent) of participating institutions had assets over $10 billion. The majority of these financial institutions reported they had a formal supplier diversity policy and they tracked contract dollars spent with minority-owned and women-owned businesses. Overall, we observed that, among the largest participating financial institutions, 49 percent had adopted leading supplier diversity practices. Conversely, among all participating institutions, only 19 percent had adopted such practices. Larger financial institutions identified the following supplier diversity practices:
- Having a formal supplier diversity policy approved by management or researching and developing a policy.
- Promoting a diverse supplier pool by having their supplier diversity managers serve on national and local supplier advocacy organizations’ committees, boards, and leadership roles. Also, ensuring procurement teams share open opportunities with certified minority- and women-owned businesses.
- Advertising (regularly) procurement opportunities to supplier diversity advocacy organizations and surrounding communities via the institution’s website.
- Partnering with supplier diversity advocacy groups and local and regional affiliates to identify and invite diverse businesses to participate in contracting opportunities. For example:
- Financial Services Roundtable for Supplier Diversity (FSRSD)
- National LGBT Chamber of Commerce (NGLCC)
- National Minority Supplier Development Council (NMSDC)
- US Pan Asian American Chamber of Commerce (USPAACC)
- Women’s Business Enterprise National Council (WBENC)
- Setting a contracting goal with diverse suppliers (e.g., spend at least XX percent).
- Reporting contract dollars spent with diverse businesses to the Diversity Officer and senior management and publishing that information on the institution’s website.
Supplier Diversity Spend
Further, 24 participating financial institutions (16 percent of all participating institutions) reported statistics on dollars spent with minority-owned and women-owned businesses. These financial institutions reported $4.1 billion in total spending: $83.4 million went to women-owned businesses and $93.6 million to minority-owned businesses.
Figure 3 shows the percent of contract dollars spent by regions with diverse businesses. Across all regions, less than 10 percent of reported contract dollars went to minority-owned or women-owned businesses.
Percent of Total Contract Dollars Spent with Minority-Owned and
Women-Owned Businesses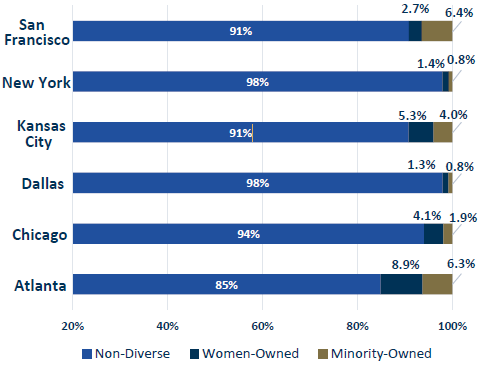
| Percent of Total Contract Dollars Spent with Minority-Owned and Women-Owned Businesses | |||
|---|---|---|---|
| FDIC Regional Office Location | Non-Diverse | Women-Owned | Minority-Owned |
| San Francisco | 91% | 2.7% | 6.4% |
| New York | 98% | 1.4% | 0.8% |
| Kansas City | 91% | 5.3% | 4.0% |
| Dallas | 98% | 1.3% | 0.8% |
| Chicago | 94% | 4.1% | 1.9% |
| Atlanta | 85% | 8.9% | 6.3% |
If a robust supplier diversity program is not an option for your financial institution the organization can still be intentional in expanding its pool of available vendors for contracting opportunities. Doing so can offer access to new business opportunities and competitive pricing.
Standard 4: Practices to Promote Transparency of Organization Diversity and Inclusion
Responses to this Standard reflect how financial institutions’ transparency and publicity are important aspects of assessing diversity policies and practices. Financial institutions that are transparent about DEI build trust with their employees, customers, and, ultimately, with the communities they serve. These institutions publish information on their DEI commitment, goals, strategies, and progress as a normal course of business.
This knowledge-sharing increases the attractiveness of the organization and can promote greater engagement with internal and external stakeholders. In addition, transparency builds accountability into the program and promotes meaningful change.
Key Results:
- In 2020, 53 percent of participating financial institutions had adopted the standard practices shown in the below table.
- DEI transparency efforts primarily focus on educating managers and employees about their organizational priorities and initiatives.
- Most participating financial institutions that did not publish information cited the lack of an existing policy that governs the publication of diversity information.
After a worldwide pandemic and the events impacting minority communities across America, people are looking for more corporate statements articulating a commitment to DEI. In addition to statements, the results of DEI efforts must be tangible, visible, ongoing, and supported by strategies and actions that demonstrate progress.
Publish DEI Information
Participating financial institutions varied in the amount of DEI information they published. The assessment results showed that a little more than half of the financial institutions shared some level of DEI information both internally and externally. At a minimum, most financial institutions stated they published current employment opportunities, high-level workforce demographics and development programs, and their DEI policy commitment. At the same time, most participating financial institutions said that their DEI strategic plan was not published externally.
However, the information was shared with internal management and employees. Financial institutions stated there was no policy governing the publication of diversity information. One way to get started and possibly overcome a concern about making information publicly available is to start with publishing information on community outreach and engagement activities. Through engagement, institutions can seek input from communities served on the level of desired information sharing.
Consistent with prior years, the lowest-rated factor continues to be financial institutions publishing “forecasts of potential employment and procurement opportunities.” Those who shared forecast information were limited to promoting future expansion opportunities in the local news and social media platforms.
Assessment Results: Practices to Promote Transparency of DEI
4.1 The financial institution publicizes its diversity and inclusion strategic plan.
4.2 The financial institution publicizes its policy on its commitment to diversity and inclusion.
4.3 The financial institution is transparent about its progress toward achieving diversity and inclusion in its workforce and procurement activities.
4.4. The financial institution publicizes its opportunities to promote diversity, which may include:
4.4(a) Current employment and procurement opportunities.
4.4(b) Forecasts of potential employment and procurement opportunities.
4.4(c) The availability and use of mentorship and developmental programs for employees and contractors.3.3(c) An ongoing process to publicize its procurement opportunities.
Average: Yes (53%); No (47%)


In general, responding financial institutions that published DEI information post it on their public website or in their annual Corporate Social Responsibility Report; Environmental, Social and Governance Report; DEI Annual Report; or Annual Report. In addition, a few financial institutions noted they also share DEI program information via social media posts on LinkedIn, Facebook, and Twitter.
Standard 5: Financial Institutions’ Self-Assessment
Leading DEI organizations assess their DEI program performance annually. They allocate resources to evaluate diversity and inclusion programs to improve performance and disclose the results. Our 2020 data identifies areas where strategies and initiatives have the intended impact, while also indicating where performance challenges still exist. By sharing information on performance, financial institutions demonstrate DEI commitment to employees, customers, suppliers, and the general public.
Key Results:
- In 2020, 67 percent of financial institutions assessed their diversity programs and shared the results.
- Most reporting financial institutions conducted an assessment, but only 32 percent shared the results externally.
We observed a significant decline in the number of financial institutions that responded “Yes” to publishing information on their assessment results. Publishing information on DEI results can help organizations build trusting relationships with customers, suppliers, and the public.
The low number of affirmative responses to the assessment factor continued to lower the overall standard rating. The assessment results found 67 percent of participating financial institutions assessed their diversity programs and shared the results, a slight increase over 2019. Below are the aggregate results for each assessment factor.
Assessment Results: Financial Institutions’ Self-Assessment
5.1 The financial institution conducts an assessment of its diversity policies and practices annually.
5.2. The financial institution monitors and evaluates its performance under its diversity policies and practices on an ongoing basis.diversity and inclusion in its workforce and procurement activities.
5.3. The financial institution publishes information pertaining to its assessment of its diversity policies and practices.
Average: Yes (67%); No (33%)


Most participating financial institutions indicated that, at a minimum, the results are shared internally with management. Some participating financial institutions stated they were not ready to share DEI program results externally, while others considered the information confidential. Despite the reluctance to disclose assessment results externally, a few financial institutions shared limited information in their Annual Report; Corporate Social Responsibility, Diversity and Inclusion Report; or Environmental, Social and Governance Report. Studies show increasing transparency on diversity is important to attracting top talent, especially among millennials who report an organization’s diversity performance is important when considering companies they want to work for.
Participating Financial Institutions
We believe all FDIC-supervised institutions can benefit from assessing their diversity practices, and we want to hear from even more of our financial institutions. During 2020, participating financial institutions continued to represent a small percentage of all FDIC-supervised financial institutions. In 2020, there were 3,230 FDIC-supervised financial institutions.5 The FDIC invited 773 of these institutions with 100 or more employees to participate in the diversity self-assessment, representing 24 percent of all FDICsupervised financial institutions.6 For the reporting period, 148 (19 percent) of the 773 financial institutions invited voluntarily conducted a self-assessment and shared the results with the FDIC. Of the participating financial institutions, 14 (or 9 percent) had assets of $10 billion or more.
5 Source: 2020 FDIC Annual Report at https://www.fdic.gov/about/financial-reports/reports/2020annualreport/index.html.
6 These institutions are the primary focus of the Interagency Policy Statement Establishing Joint Standards for Assessing the Diversity Policies and Practices of Entities Regulated by the Agencies.
Response Rate
Figure 4 illustrates the number of invited institutions, submissions, and response rates by FDIC region. The number of participating financial institutions by region ranged from a low of 16 in the Kansas City Region to a high of 46 in the New York Region.
2020 Reporting Period Response Rate by FDIC Region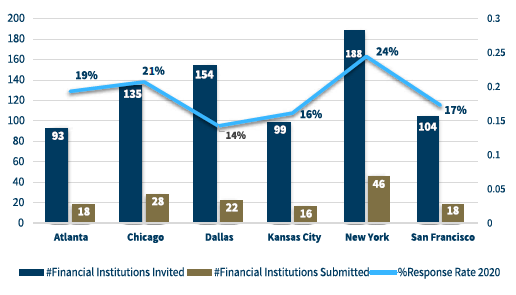
| 2020 Reporting Period Response Rate by FDIC Region | |||
|---|---|---|---|
| FDIC Regional Office Location | Number of Financial Institutions Invited | Number of Financial Institutions Submitted | Response Rate 2020 |
| Atlanta | 93 | 18 | 19% |
| Chicago | 135 | 28 | 21% |
| Dallas | 154 | 22 | 14% |
| Kansas City | 99 | 16 | 16% |
| New York | 188 | 46 | 24% |
| San Francisco | 104 | 18 | 17% |
U.S. Census data shows that racial and ethnic demographics in the country are shifting.7 Therefore, the customers a financial institution serves today may be different in the future. Maintaining a workforce that reflects the community served, and understanding the needs of the evolving community impacts the effectiveness of the services provided and, ultimately, the effectiveness of the organization.
7 FDIC Community Banking Study (December 2020), available at https://www.fdic.gov/ resources/community-banking/cbi-study.html.
Asset Size
After the 2020 reporting period, OMWI decided to use the Modified Quarterly Banking Profile (QBP) Asset Threshold to segment participating financial institutions because the Community Reinvestment Act (CRA) Asset-Size Threshold definitions do not provide sufficient asset granularity.
As a result, we are transitioning from three to five asset categories, which gives us better visibility into the diversity practices of our institutions by asset size.
Participating financial institutions represented 38 percent of the total employee population and 39 percent of the total assets ($3.3 billion) held by invited financial institutions.8 Figure 5 illustrates the responding financial institutions by asset size.
Responding Financial Institutions by Asset Size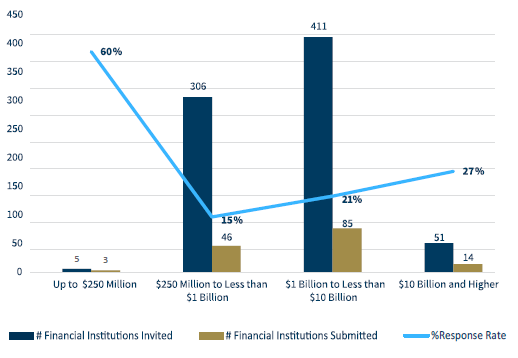
| Responding Financial Institutions by Asset Size | |||
|---|---|---|---|
| Asset Size | Number of Financial Institutions Invited | Number of Financial Institutions Submitted | Response Rate |
| Up to $250 Million | 5 | 3 | 60% |
| $250 Million to Less than $1 Billion | 306 | 46 | 15% |
| $1 Billion to Less than $10 Billion | 411 | 85 | 21% |
| $10 Billion and Higher | 51 | 14 | 27% |
8 Interagency Policy Statement Establishing Joint Standards for Assessing the Diversity Policies and Practices of Entities Regulated by the Agencies targets financial institutions with 100 or more employees.
Conclusion
As in previous years, the Office of Minority and Women Inclusion (OMWI) notes that participating financial institutions have progressed in some areas but demonstrated limited advancement in others. FDIC-supervised financial institutions continue to demonstrate strong performance in the organizational commitment to building an inclusive culture and workforce diversity. However, with respect to supplier diversity, transparency with DEI progress, assessment results remained flat with little or no change since the first reporting period in 2016. For this reason, we focused the report on the areas within each of the five standards where a noticeable number of financial institutions had not affirmed compliance with one or more assessment factors. These areas lower the overall standard rating across all participating financial institutions.
Key areas where performance is lacking are: DEI policies, Supplier Diversity Officer, and transparency on DEI performance. In those instances where the financial institution did not respond “Yes” to an assessment factor, several stated their intent to revisit the decision or that they were in the process of implementing the diversity practice. This report provides some guidance in those areas; in addition, OMWI offers technical assistance for institutions that want to enhance their programs.
In the future, we believe our smaller financial institutions can also benefit from participating in the DSA. Smaller financial institutions can use this report tool to find best practices, guide discussions, and define what DEI means in their communities. Management can then use data to communicate specifically about their diversity challenges and identify opportunities to make changes that pay off in the future. For example, conducting outreach and building relationships with communities the financial institution may have previously overlooked is a good strategy for identifying new opportunities.
We encourage our financial institutions to share more information on their DEI successes, challenges, and practices in the future through the DSA narrative comments, particularly in areas where the financial institution does not respond “Yes” to an assessment factor. The FDIC may use these narratives to identify opportunities to provide technical assistance to our financial institutions.
Financial Institution Diversity Self-Assessment 2020 Results | 29 Resources
The below list of resources highlights strategies and initiatives in which the FDIC is engaged to ensure that we ourselves build and maintain an organization that reflects the communities we serve. These resources are also provided for illustrative purposes to assist FDIC-supervised financial institutions in developing diversity programs.
- Organizational Commitment to Diversity and Inclusion
- Workforce Profile and Employment
- Procurement and Business Practices – Supplier Diversity
- Practices to Promote Transparency
- See the FDIC Diversity Reports Under Workforce Profile and Employment
- Practices to Promote Transparency
Appendix
Diversity, Equity and Inclusion Policy Sample Template for Illustrative Purpose
[Company Name] is committed to fostering, cultivating and preserving a culture of diversity, equity and inclusion. Our human capital is the most valuable asset we have. The collective sum of the individual differences, life experiences, knowledge, inventiveness, innovation, self-expression, unique capabilities and talent that our employees invest in their work represents a significant part of not only our culture, but our reputation and company’s achievement as well.
We embrace and encourage our employees’ differences in age, color, disability, ethnicity, family or marital status, gender identity or expression, language, national origin, physical and mental ability, political affiliation, race, religion, sexual orientation, socio-economic status, veteran status, and other characteristics that make our employees unique.
[Company Name’s] diversity initiatives are applicable—but not limited—to our practices and policies on recruitment and selection; compensation and benefits; professional development and training; promotions; transfers; social and recreational programs; layoffs; terminations; and the ongoing development of a work environment built on the premise of gender and diversity equity that encourages and enforces:
- Respectful communication and cooperation between all employees.
- Teamwork and employee participation, permitting the representation of all groups and employee perspectives.
- Work/life balance through flexible work schedules to accommodate employees’ varying needs.
- Employer and employee contributions to the communities we serve to promote a greater understanding and respect for the diversity.
All employees of [Company Name] have a responsibility to treat others with dignity and respect at all times. All employees are expected to exhibit conduct that reflects inclusion during work, at work functions on or off the work site, and at all other company-sponsored and participative events. All employees are also required to attend and complete annual diversity awareness training to enhance their knowledge to fulfill this responsibility.
Any employee found to have exhibited any inappropriate conduct or behavior against others may be subject to disciplinary action.
Employees who believe they have been subjected to any kind of discrimination that conflicts with the company’s diversity policy and initiatives should seek assistance from a supervisor or an HR representative.
Source: Society of Human Resource Management